


This week, Futurerent CEO Godfrey Dinh sat down with Arjun Paliwal, founder of InvestorKit and one of Australia's most data-driven property researchers, for a live webinar on what the current rate environment actually means for property investors in 2026.
If you missed it, the recording is above. But if you want the distilled version, the insights that matter and the frameworks you can act on, this post covers the key takeaways.
With the RBA delivering two consecutive rate hikes and inflation proving stickier than expected, the question on most investors' minds is what this environment actually means for their portfolio. We've covered the macro picture in detail over at our March market update, including the CPI data, the housing inflation story, and the CGT and negative gearing developments worth watching.
This post is about the bigger question that sits underneath all of that: how do you actually invest successfully in this environment?
Key takeaways
- Rates at 5% are historically normal. The COVID era was the anomaly, not the benchmark.
- Rate hikes don't signal a property crash. The economy, not inflation alone, drives that outcome.
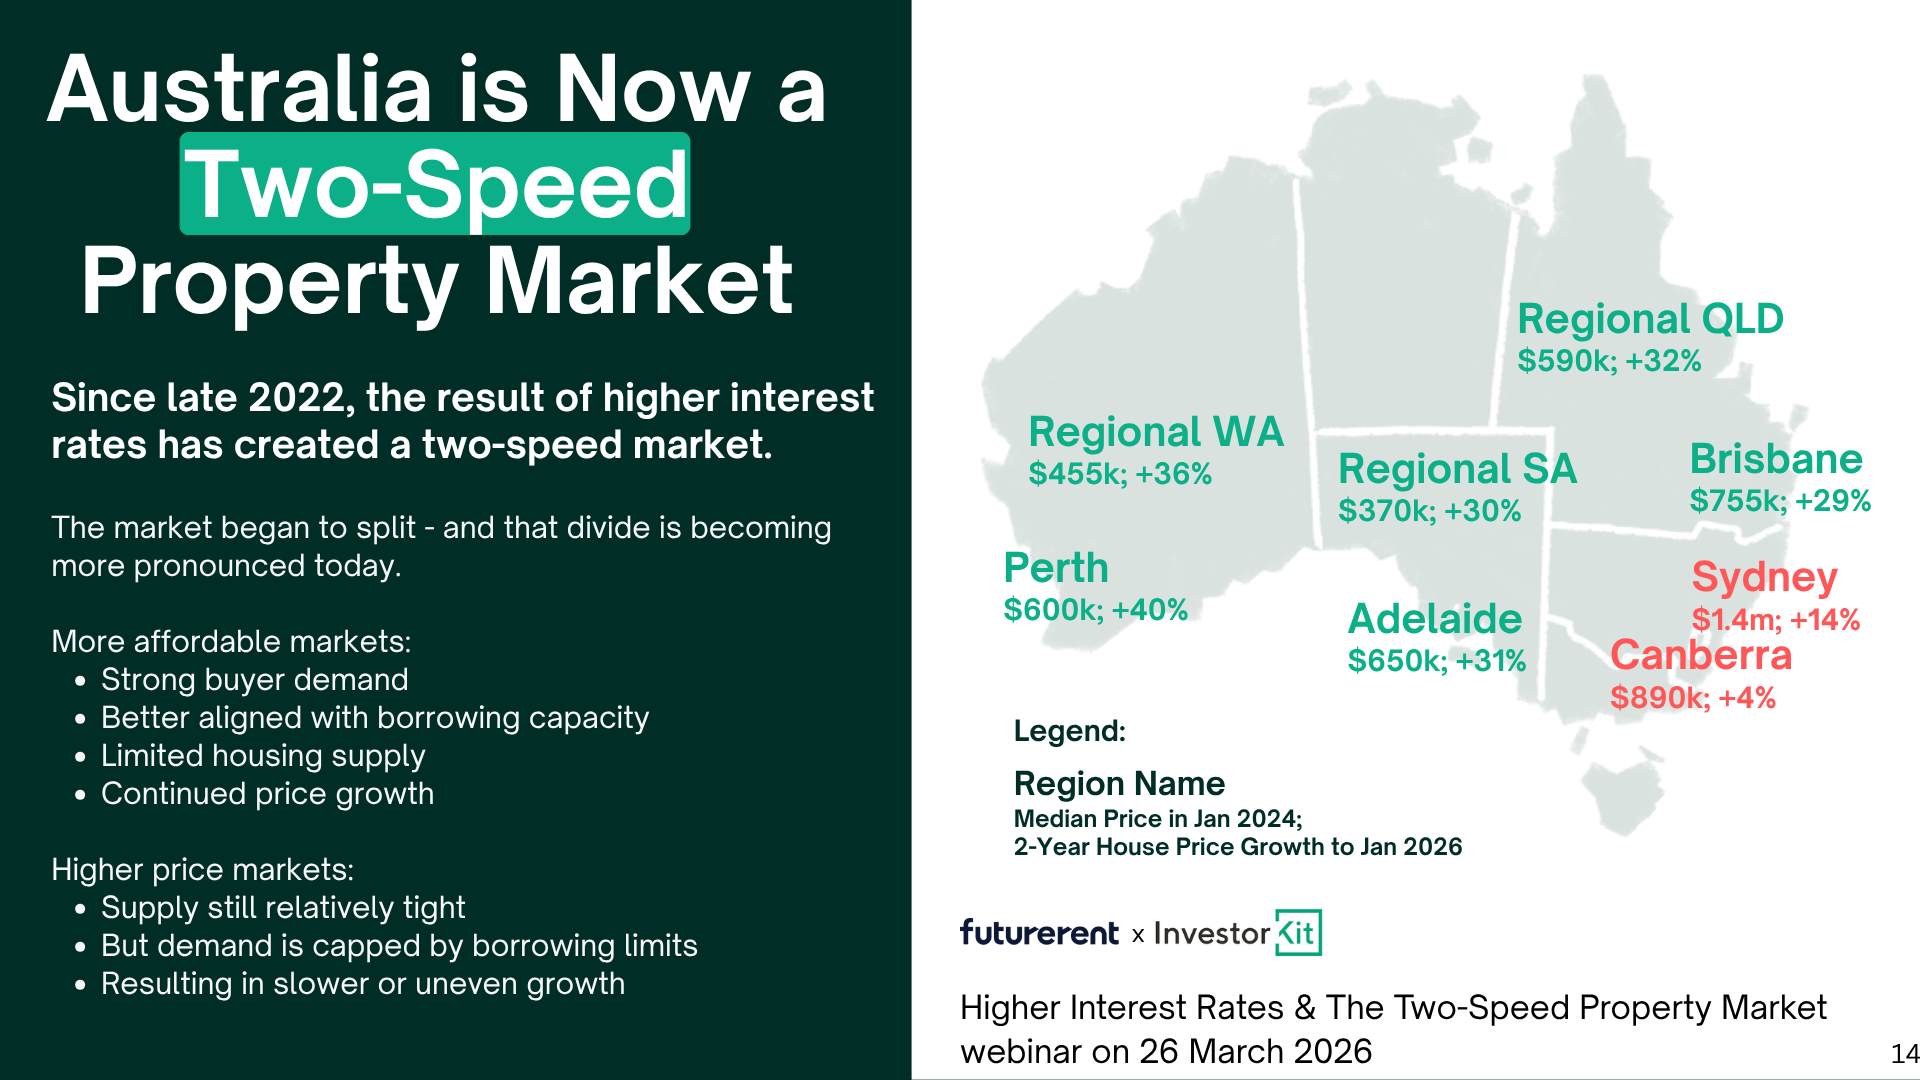
- Australia's market has split into two speeds since late 2022. Several premium suburbs are losing value, not just growing slowly.
- The two-speed divide runs within cities too, not just between them.
- "Blue chip" is a marketing label. The 10-year data shows non-blue-chip houses consistently outperform, including against blue chip units.
- Eleven market pressure indicators have never been wrong in Australian property history. They tell you where to look.
- Four markets currently showing strong signals: Dubbo, Ballarat, Ipswich and Launceston.
- Your portfolio strategy in accumulation should be different from your strategy approaching retirement.
- Having capital ready to move is often what separates investors who act from those who watch.
Rates feeling heavy? That's recency bias.
One of the sharpest points of the session was a simple reframe.
When you look at the full history of Australia's cash rate, 5% is not an anomaly. It is historically normal. What was abnormal was the COVID-era near-zero rates, a crisis response tool deployed under extraordinary circumstances. Those rates conditioned a generation of investors to expect cheap money as the default. It wasn't.
Arjun's team models portfolios to a 5% rate assumption regardless of what the current rate is. The principle: when times are good, plan for 5%. When times are hard, you're already there. Don't celebrate when rates are low. Don't panic when they're not.
The historical pattern of rate cycles is also instructive. Rates tend to rise fast and fall slow. They plateau with some volatility at the top. And over the long arc, the trend has been down, driven by structural forces like credit growth, wage-to-price decoupling, and longer mortgage terms that make the same debt serviceable at progressively lower rates. None of that has changed.
The recency bias is real. But it can be managed with data and a longer time horizon.
Do rate hikes mean a recession is coming? And what does that mean for property?
This came up directly in the session, and the answer is more nuanced than the headlines suggest.
Rate hikes typically happen in response to a strong economy, not a weak one. The RBA raises rates to cool demand that's running hot. That is not the same thing as an economy in trouble. And while Australia has technically experienced brief recessionary GDP readings in the past six years, property markets in many locations kept growing through them.
The more important point: if the economy does weaken materially, the same tool that's being used to fight inflation gets redirected to support growth. Rates come down. The RBA has demonstrated it will move decisively when the economy needs it.
What's different this time is that the current inflation is largely supply-side driven: energy costs, construction costs, global commodity pressures. As Godfrey noted in the session, the February CPI data showed housing itself is the dominant inflation contributor right now. Interest rates are a blunt tool against that kind of inflation. The RBA knows it. Investors should know it too.
The practical implication: don't confuse a rate-hiking environment with a property-destroying environment. The two have historically coexisted just fine in the right markets.
Why the market is now split, and which side you want to be on
Since late 2022, Australia's property market has been dividing into two distinct tracks. The gap is widening.
Affordable markets (properties in the $500K–$800K range, often in regional centres or outer suburban corridors) have continued to grow strongly. Buyer demand aligns with borrowing capacity. Supply remains constrained. Vacancy rates are low. Days on market are falling. Fundamental housing needs driven by population growth will more directly impact this end of the market, resulting in faster growth than at the premium end of the market.
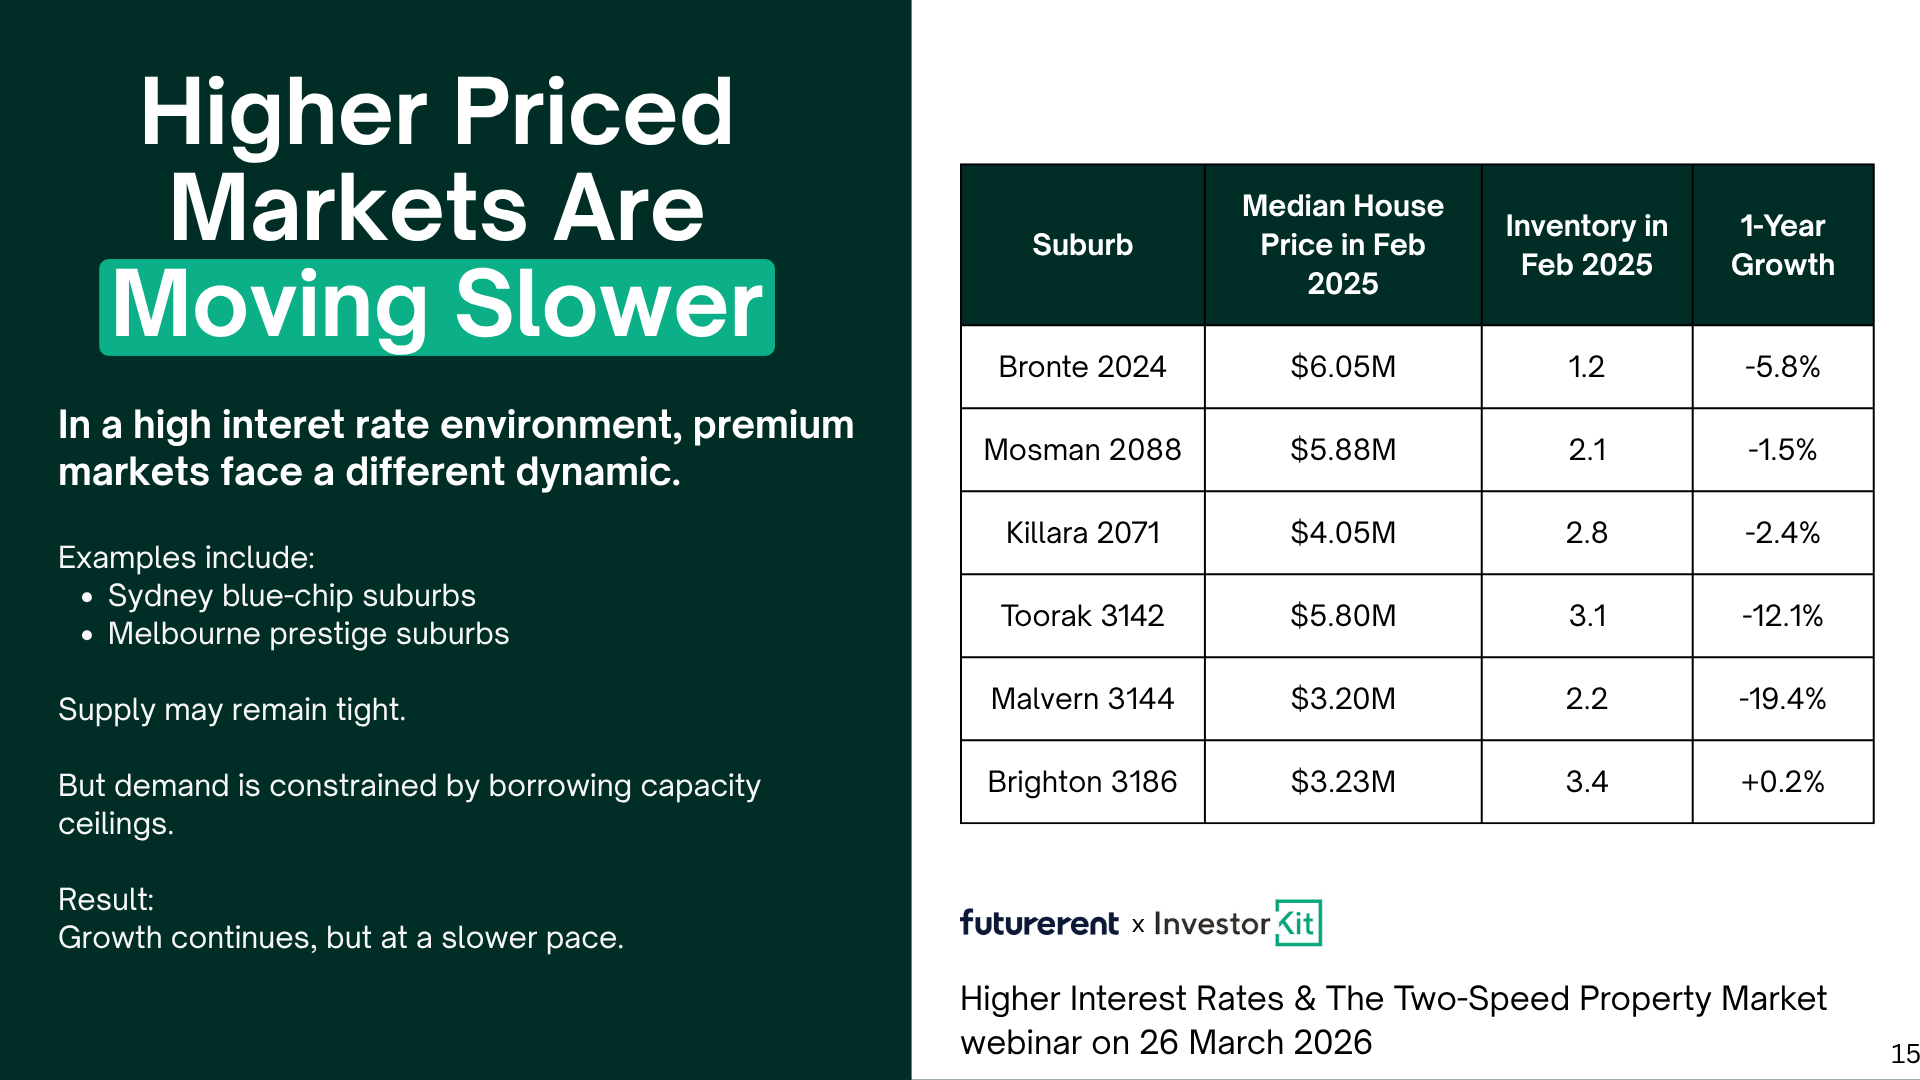
Premium markets (Sydney's inner suburbs, Melbourne's prestige belt, Canberra) face a different dynamic. Supply may still be relatively tight, but demand is capped by borrowing limits. At $3M–$6M price points, the pool of people who can actually complete a transaction in a higher-rate environment is simply smaller and less driven by population growth. In the year to February 2025, Toorak was down 12.1%, Malvern down 19.4%, Bronte down 5.8%, Mosman down 1.5%, Killara down 2.4%. Some of these markets rebounded in 2025, however it’s expected that rising rates in 2026 may result in a continuation of the pressure felt toward the end of 2025 after nearly three consecutive years of rate hikes that began in 2022.
The two-speed divide also runs within cities, not just between them. Melbourne is a clear example. As an overall market it has grown around 2–3% over the past 12 months. But strip out the postcode-level data and the picture is far more varied. Outer and middle suburbs with constrained supply, such as Broadmeadows ($580k, 1.1 months of stock, +7.6% year on year) and Narre Warren ($741k, 1.8 months of stock, +7.9%), are performing well above the city average. Brighton, with a median of $3.22M and 3.4 months of stock, returned just +0.2%. Same city. Very different outcomes.
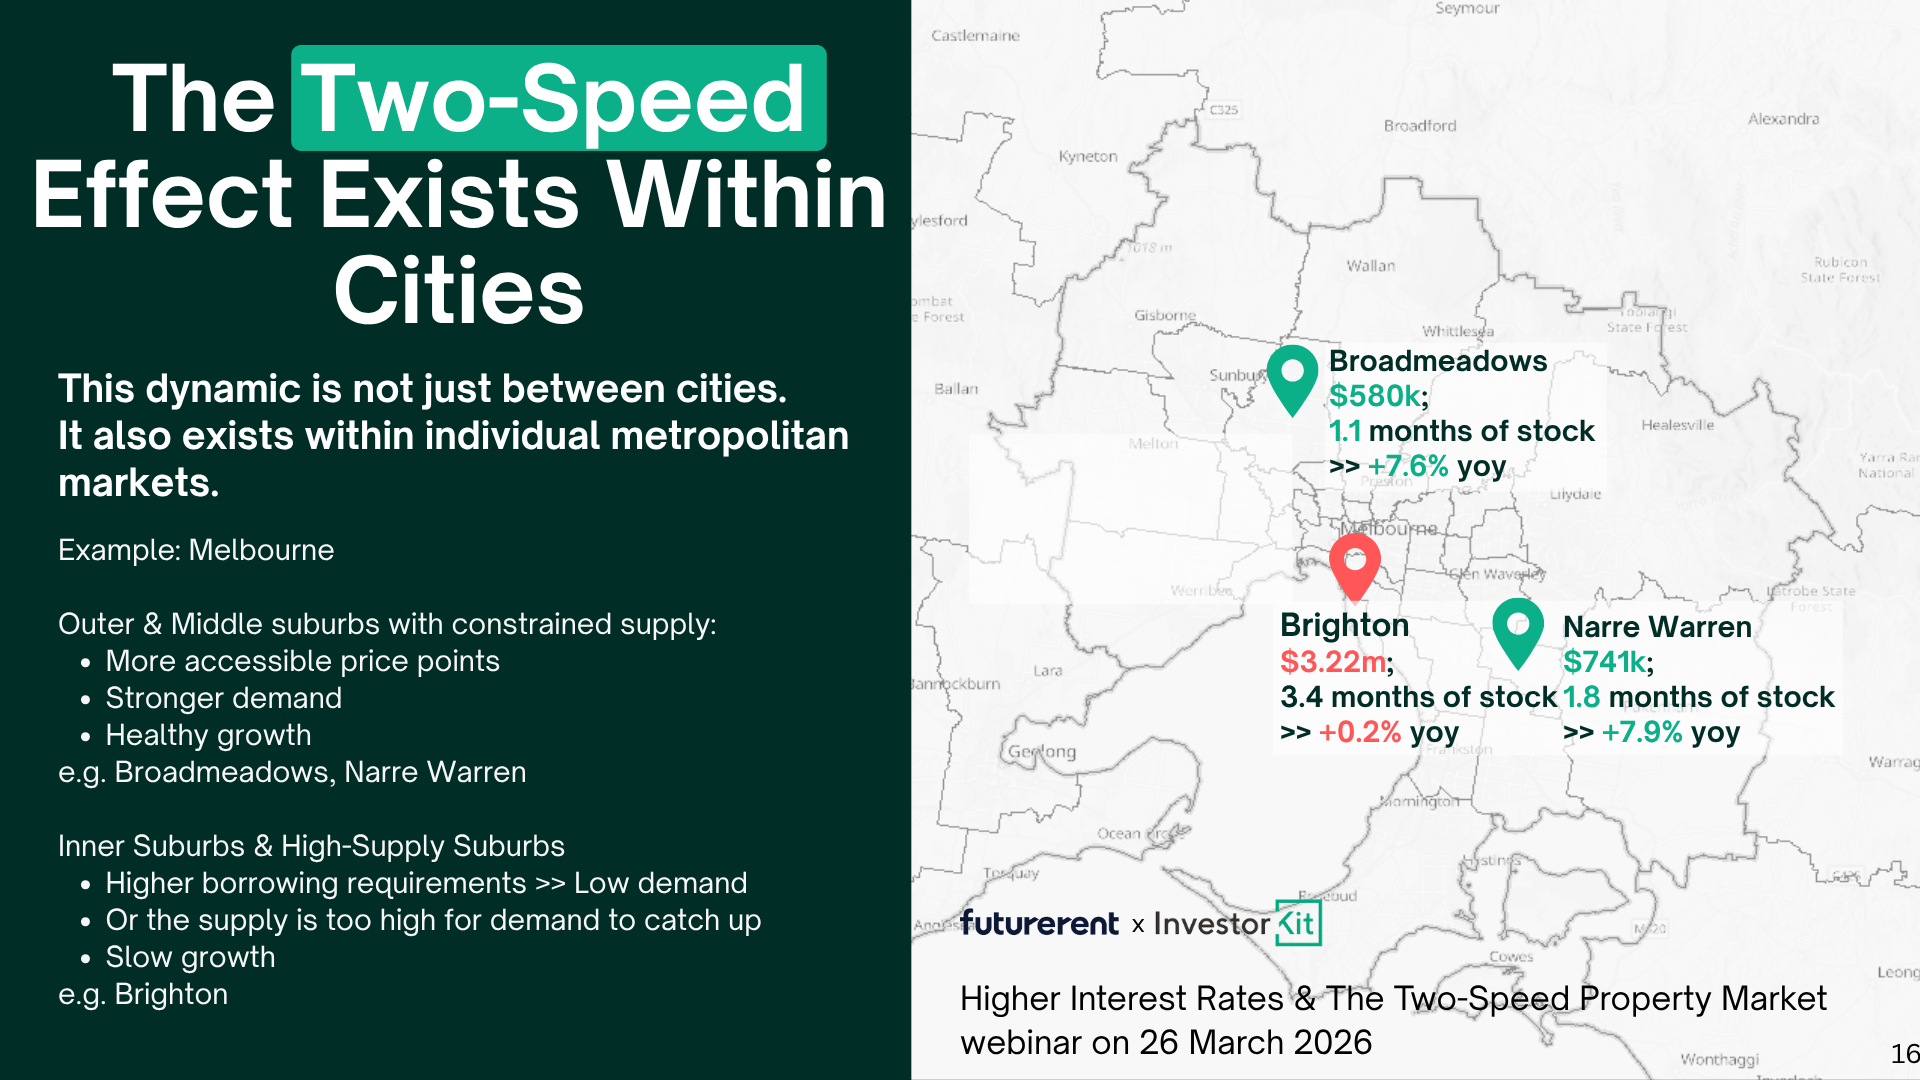
This matters because investors who write off an entire city based on headline figures can miss strong pockets within it. The question to ask is not "is Melbourne performing?" but "which parts of Melbourne have the supply, demand and affordability dynamics that drive growth?"
The markets where activity is highest are the ones where affordability aligns with current borrowing capacity, not the ones with the best postcodes.
The "blue chip" myth is costing investors money
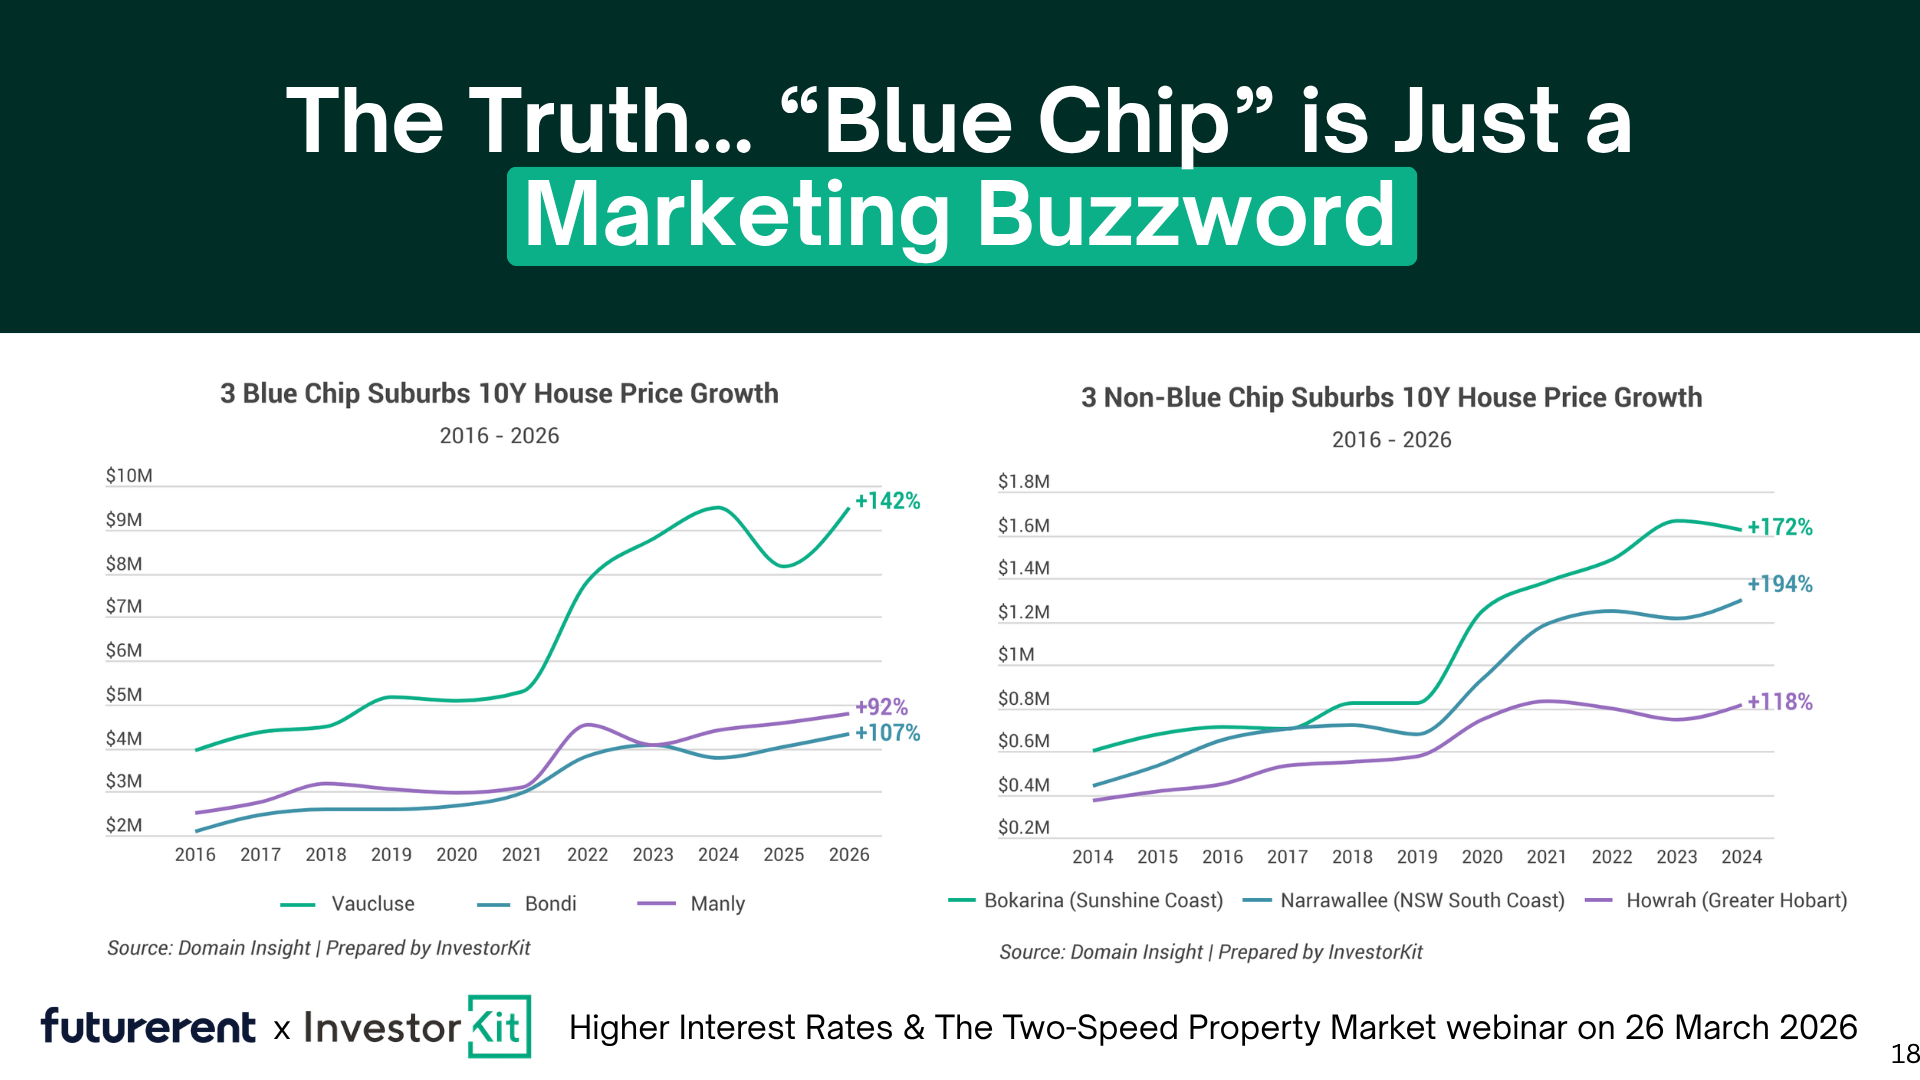
One of the more direct points from the session: the idea that blue chip property is the safe, high-performing choice is largely a marketing story, not a data story.
Over a 25-year period, more than 85% of local government areas across Australia have produced 5% or greater compounding growth. When you exclude mining towns and statistically insignificant markets, that number rises above 92%. The vast majority of Australian markets have had their time to perform.
The data comparison in the session made the point sharply. Over the decade from 2016 to 2026, three well-known blue chip suburbs (Vaucluse +142%, Bondi +107%, Manly +92%) were tracked against three non-blue-chip suburbs: Bokarina on the Sunshine Coast (+172%), Narrawallee on the NSW South Coast (+194%), and Howrah in Greater Hobart (+118%). The non-blue-chip markets outperformed, at a fraction of the entry price.
But the more practically useful finding is what happens when you take the "best area I can afford" logic one step further, and buy a blue chip unit instead of a house. The data shows that even this compromise doesn't pay off. Over the same period, houses in Dubbo (+114%), Wagga Wagga (+109%) and East Maitland (+91%) all outperformed blue chip units in Vaucluse (+53%), Bondi (+49%) and Killara (+20%). The argument that you should buy the best postcode you can access, even if it means a unit, simply doesn't hold up when you put the numbers side by side.
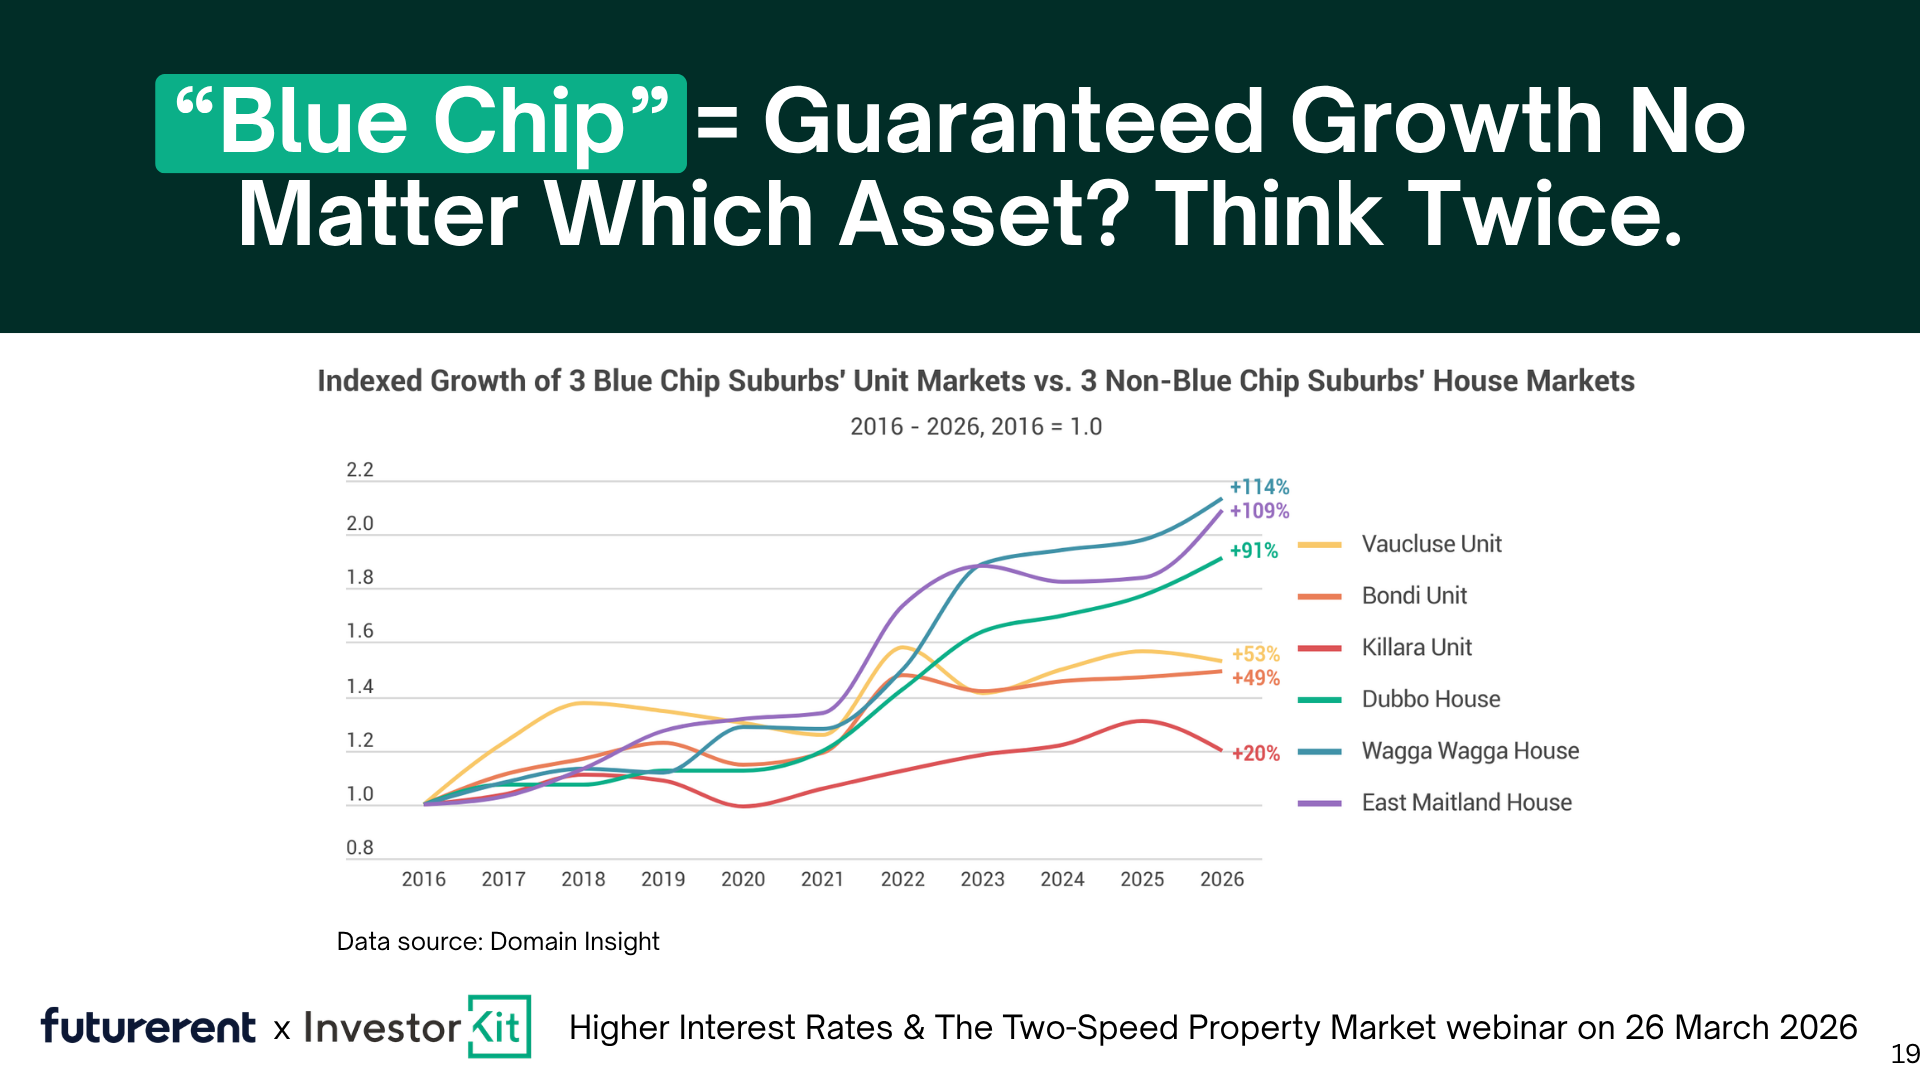
When you buy a blue chip unit to get into a premium location at a more accessible price, you also take on strata risk, body corporate costs, and supply risk from new development. A house in a growth regional or outer metro market, at a similar or lower budget, often avoids all of those while delivering stronger returns.
The principle isn't that blue chip areas are bad. It's that the label "blue chip" tells you almost nothing useful about future performance. What drives growth is market conditions, not marketing.
What to actually look for: the market pressure framework
So what does predict growth? The session covered a concrete set of indicators, what Arjun calls "market pressure", that have never been wrong in Australian property history.
There has never been a time when all of these conditions existed and markets grew:
- Listing volumes well above the 5-year average and rising
- Building approvals extremely high
- Auction clearance rates low and falling
- Vacancy rates high and rising
- Sales volumes trending down
- Vendor discounting trending up
- Days on market trending up and high
- Stock on market elevated
- Population declining
- Infrastructure spend per capita extremely low
Flip every one of those over, and you have a market that has never not grown.
The key insight here: focus on effects, not causes. The causal stories ("a train station is being built" or "the Olympics are coming") are too uncertain and too long-range. The market pressure indicators are observable now, and they have a direct, proven relationship with price growth.
This is the difference between making a property decision based on a headline and making one based on data.
Markets showing strength right now
The session walked through specific markets currently showing strong pressure indicators.
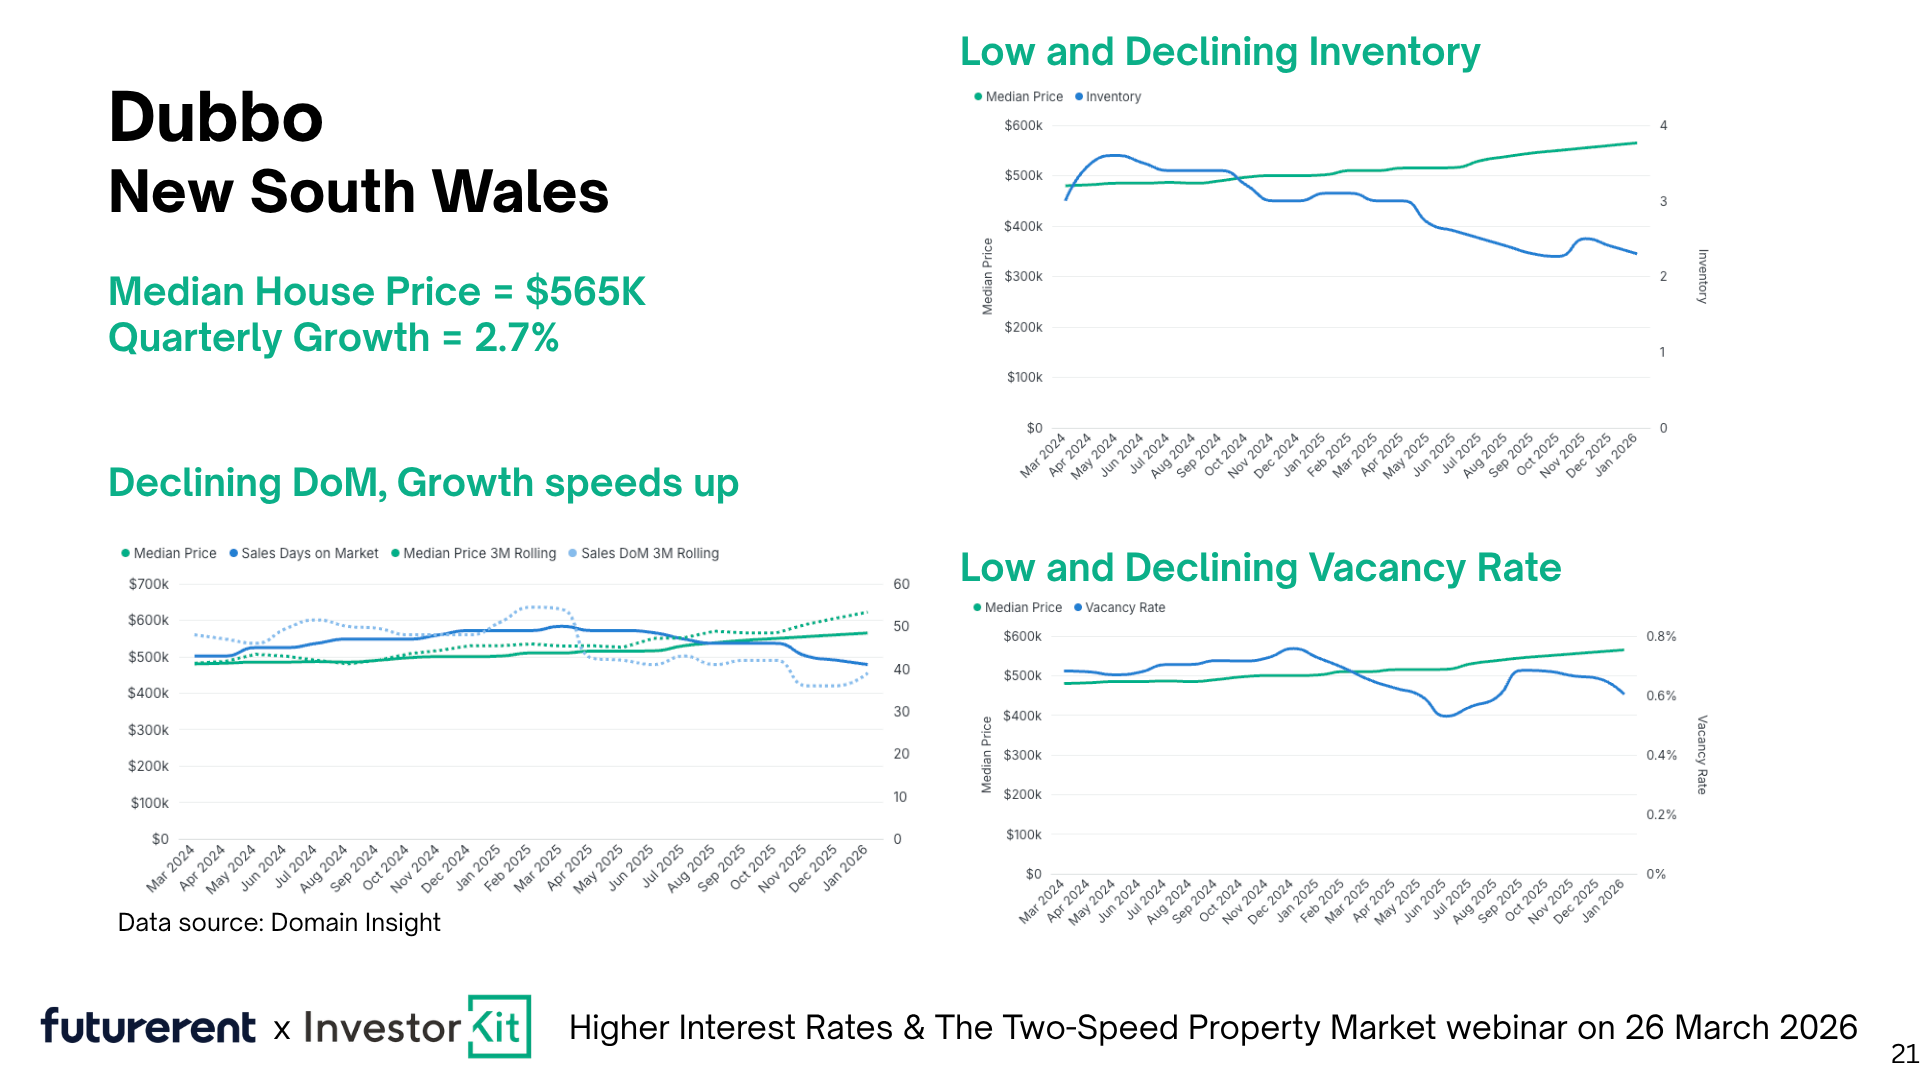
Dubbo, NSW (median house price $565K) is running at 2.7% quarterly growth, annualising well into double digits. Days on market are falling fast. Vacancy rates are low and declining. Housing inventory is suppressed. The local economy is diversified, unemployment is below national averages, and infrastructure spend per capita is high. Regional migration from capital cities, a trend that accelerated during COVID and has not reversed, continues to support demand.
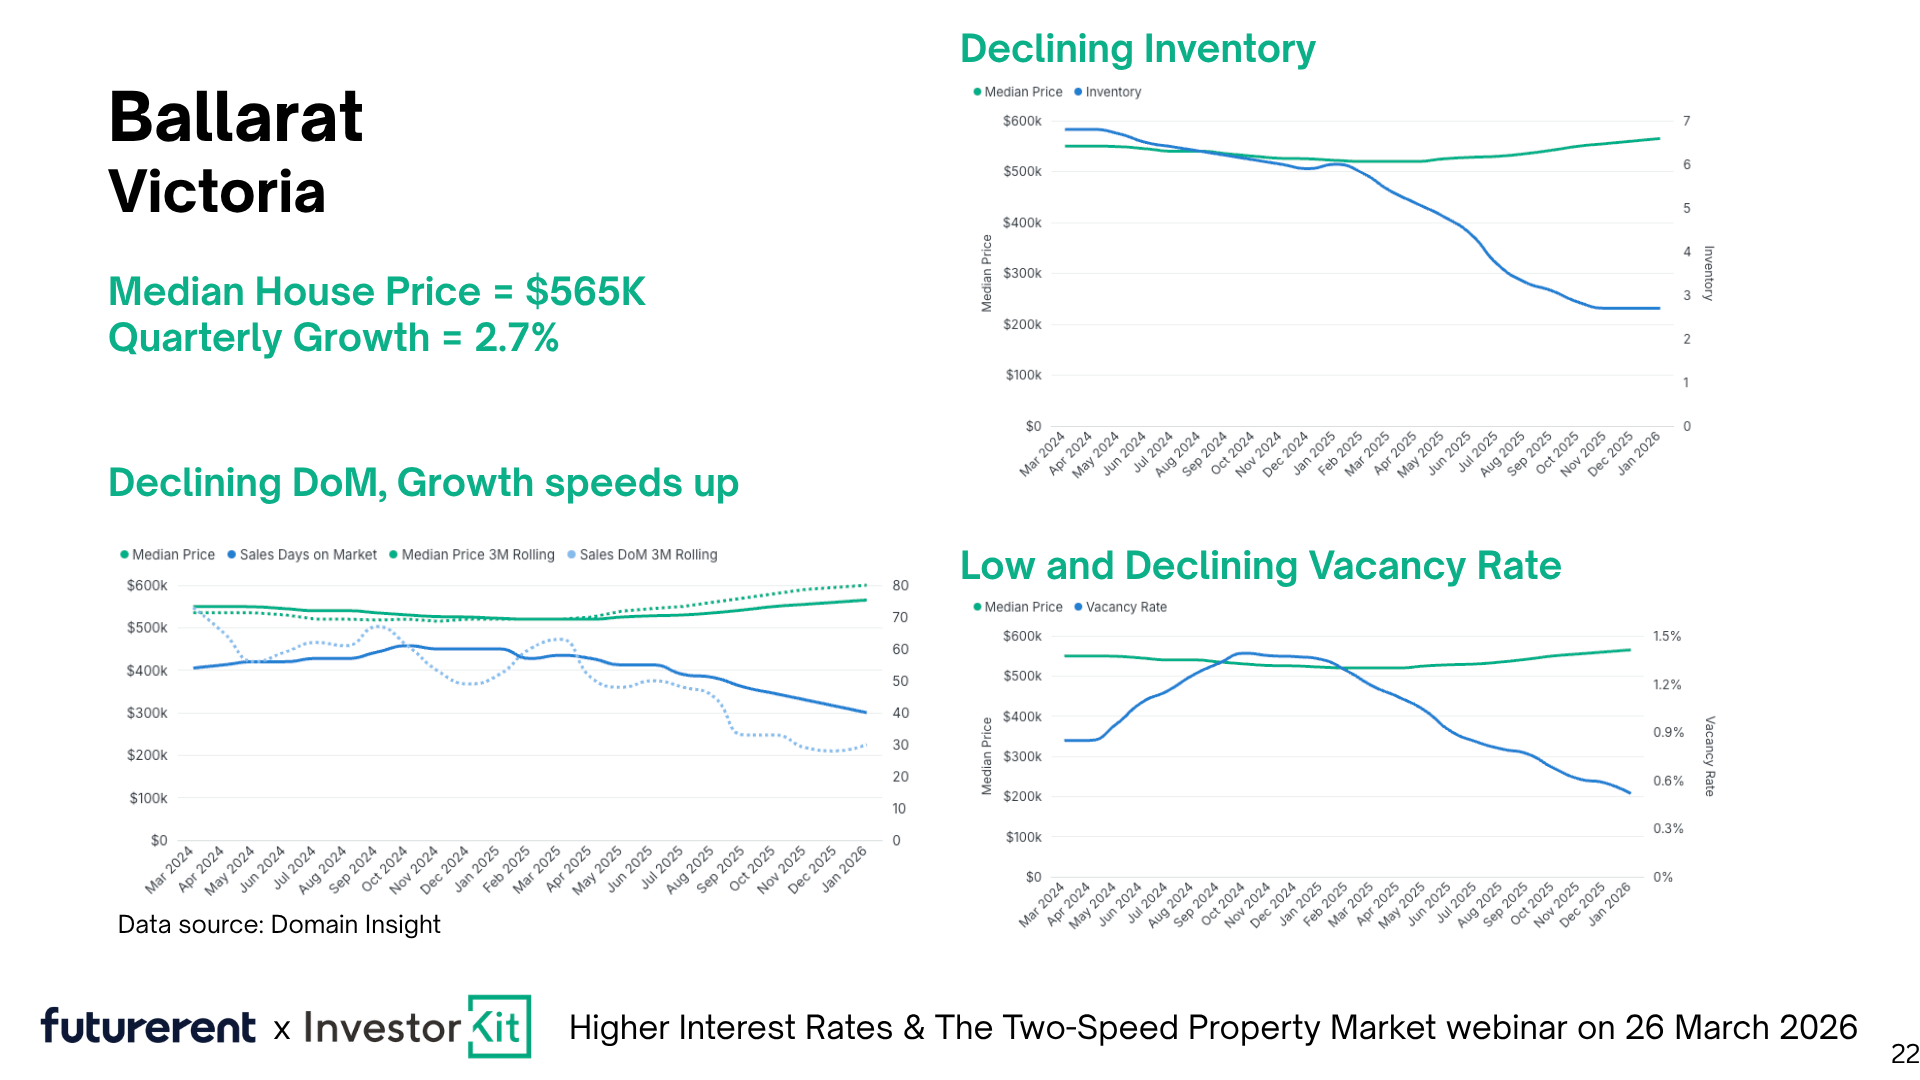
Ballarat, VIC (median house price $565K) illustrates the importance of looking past state-level narratives. While Victoria's land taxes and state debt generate constant commentary, Ballarat is running at similar quarterly growth rates, with inventory at roughly half its level from the prior year and vacancy rates near zero. Affordable entry points with houses starting in the low-to-mid $500Ks.
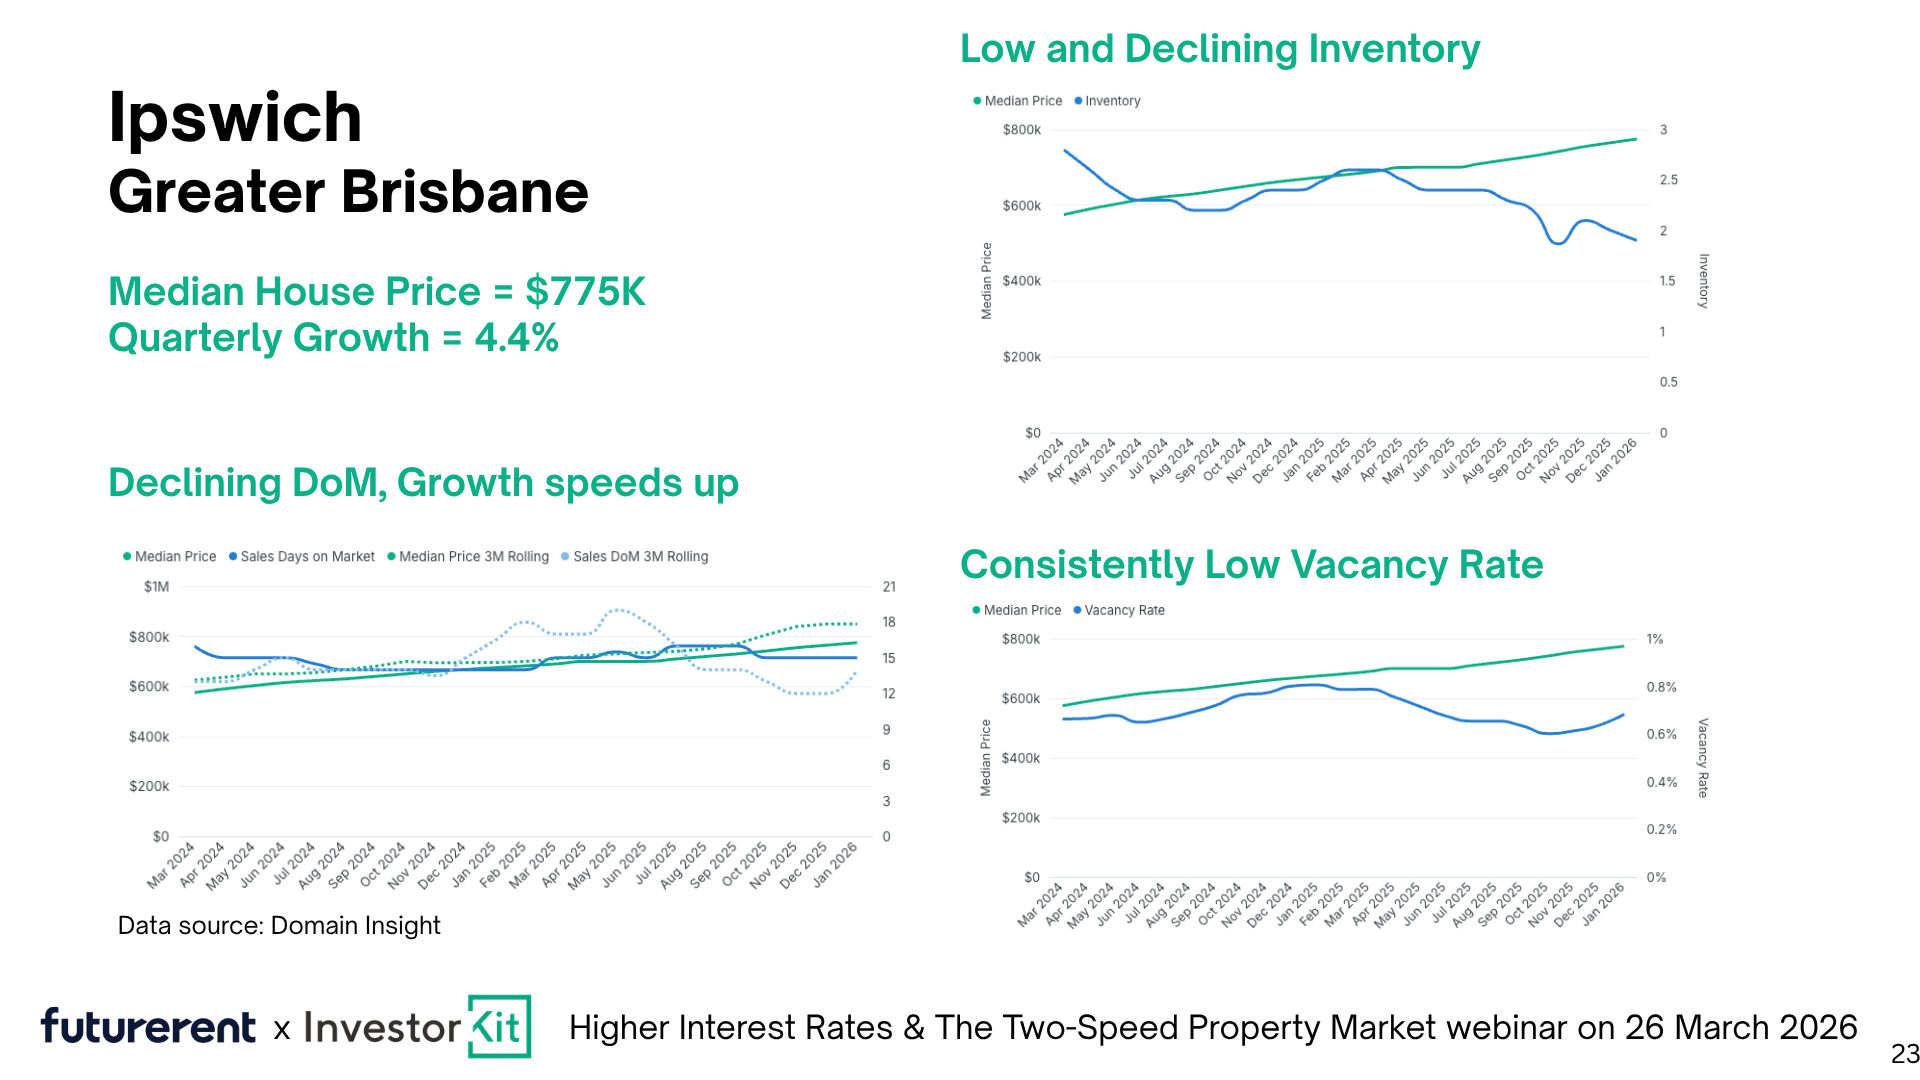
Ipswich, Greater Brisbane (median house price $775K, quarterly growth 4.4%) was dismissed by many as having had its run. The data says otherwise. It's now in what Arjun calls a "second wind," with declining days on market, low vacancy, and annualised growth above 16%. The initial boom is over, but a new growth cycle is clearly underway.
Launceston, Tasmania (median house price $608K) shows similar characteristics: 3% quarterly growth, near-zero vacancy rates, and inventory declining consistently.
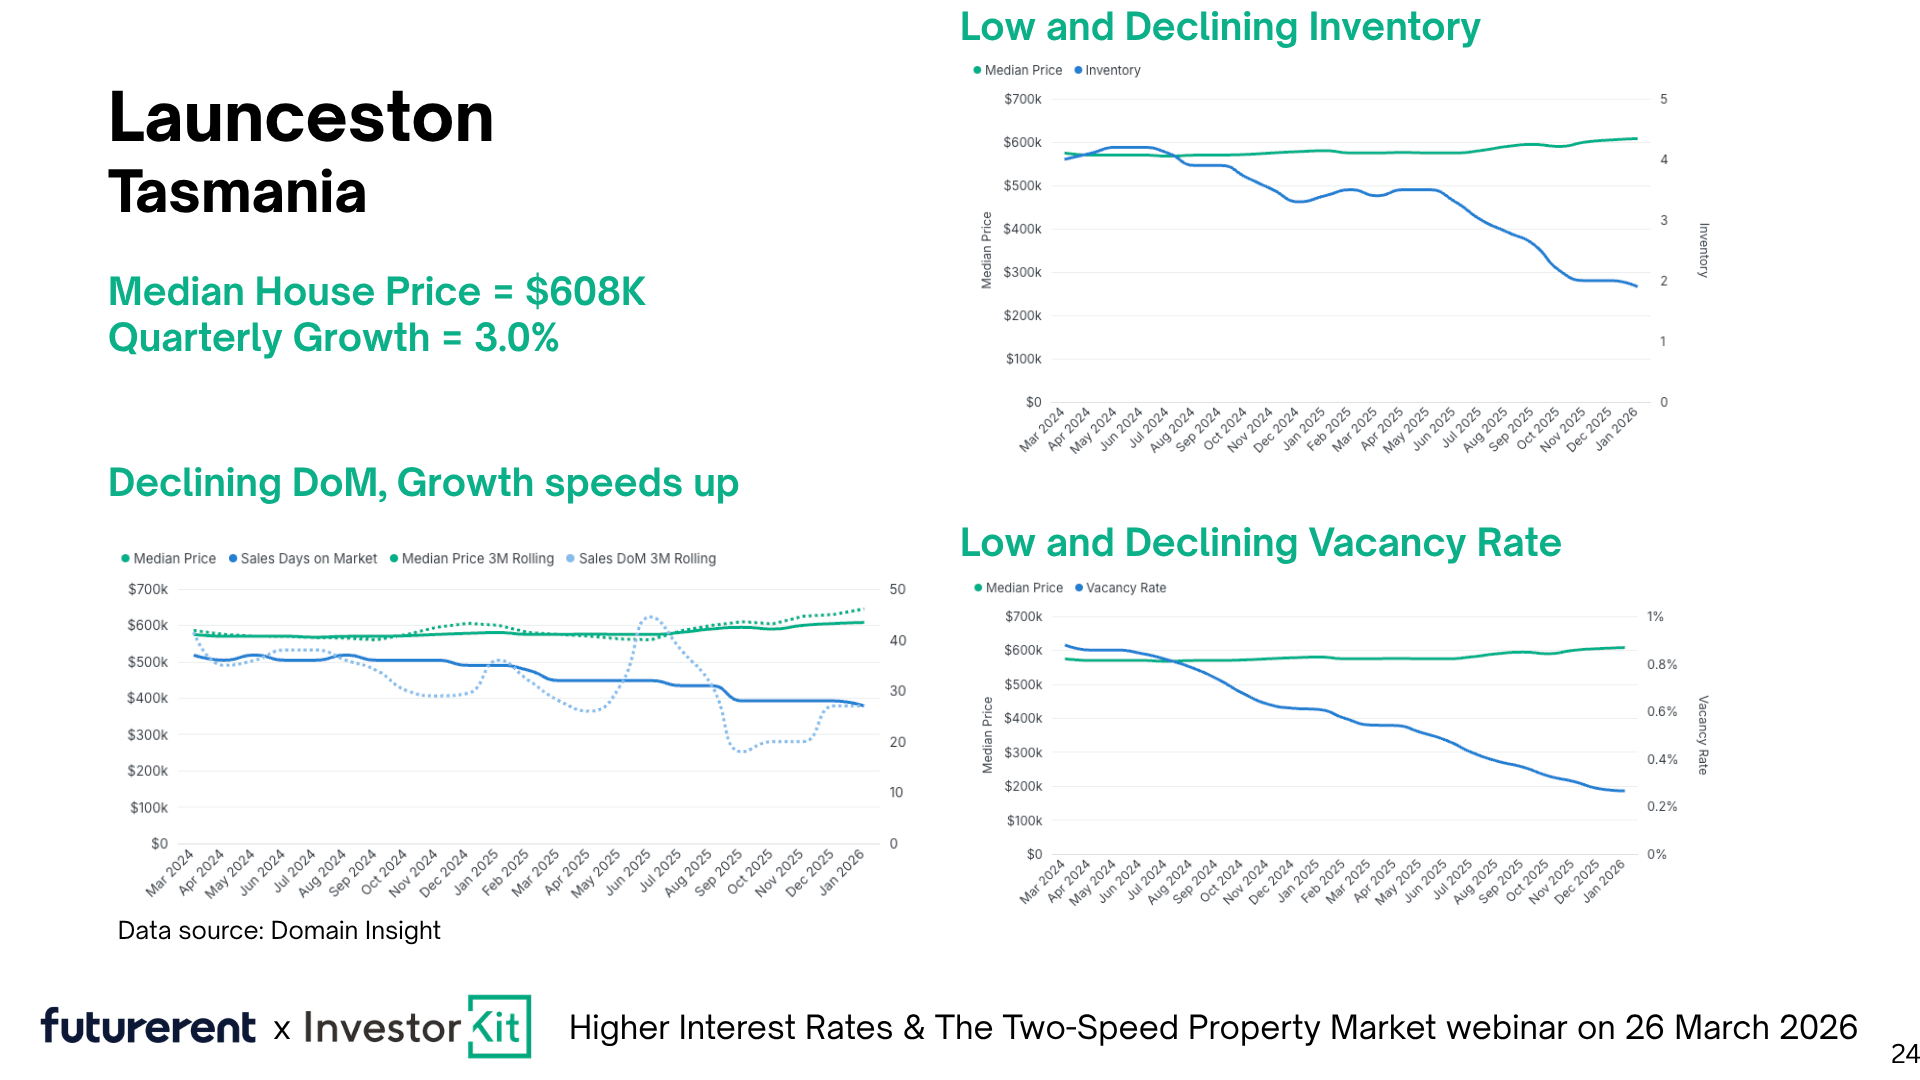
The common threads across all four: affordability at the national level, tightening supply of established housing, low vacancy, and strong local economic fundamentals.
Five principles for investing in any market environment
Rather than a prescription about which market or asset type to buy, the session outlined five fundamentals that create durable portfolios regardless of what rates are doing.
- Know your current position.
What do you have, and what is it actually doing? Annual portfolio reviews are not optional if you want to make informed decisions about what to do next. - Know where you're going.
What is your investment horizon, and what outcome are you building toward? The strategy determines the asset, not the other way around. - Diversify across markets.
Concentration increases risk. Spreading across markets and states increases the probability of compounding growth happening somewhere in your portfolio at any given time. - Build a team.
Finance, accounting, buying, legal. The investors who move forward consistently are the ones with professionals around them, not the ones waiting for certainty before they act. - Back your decisions with data.
Not headlines, not narratives, not what worked for someone else in a different cycle. The market pressure indicators are observable. Use them.
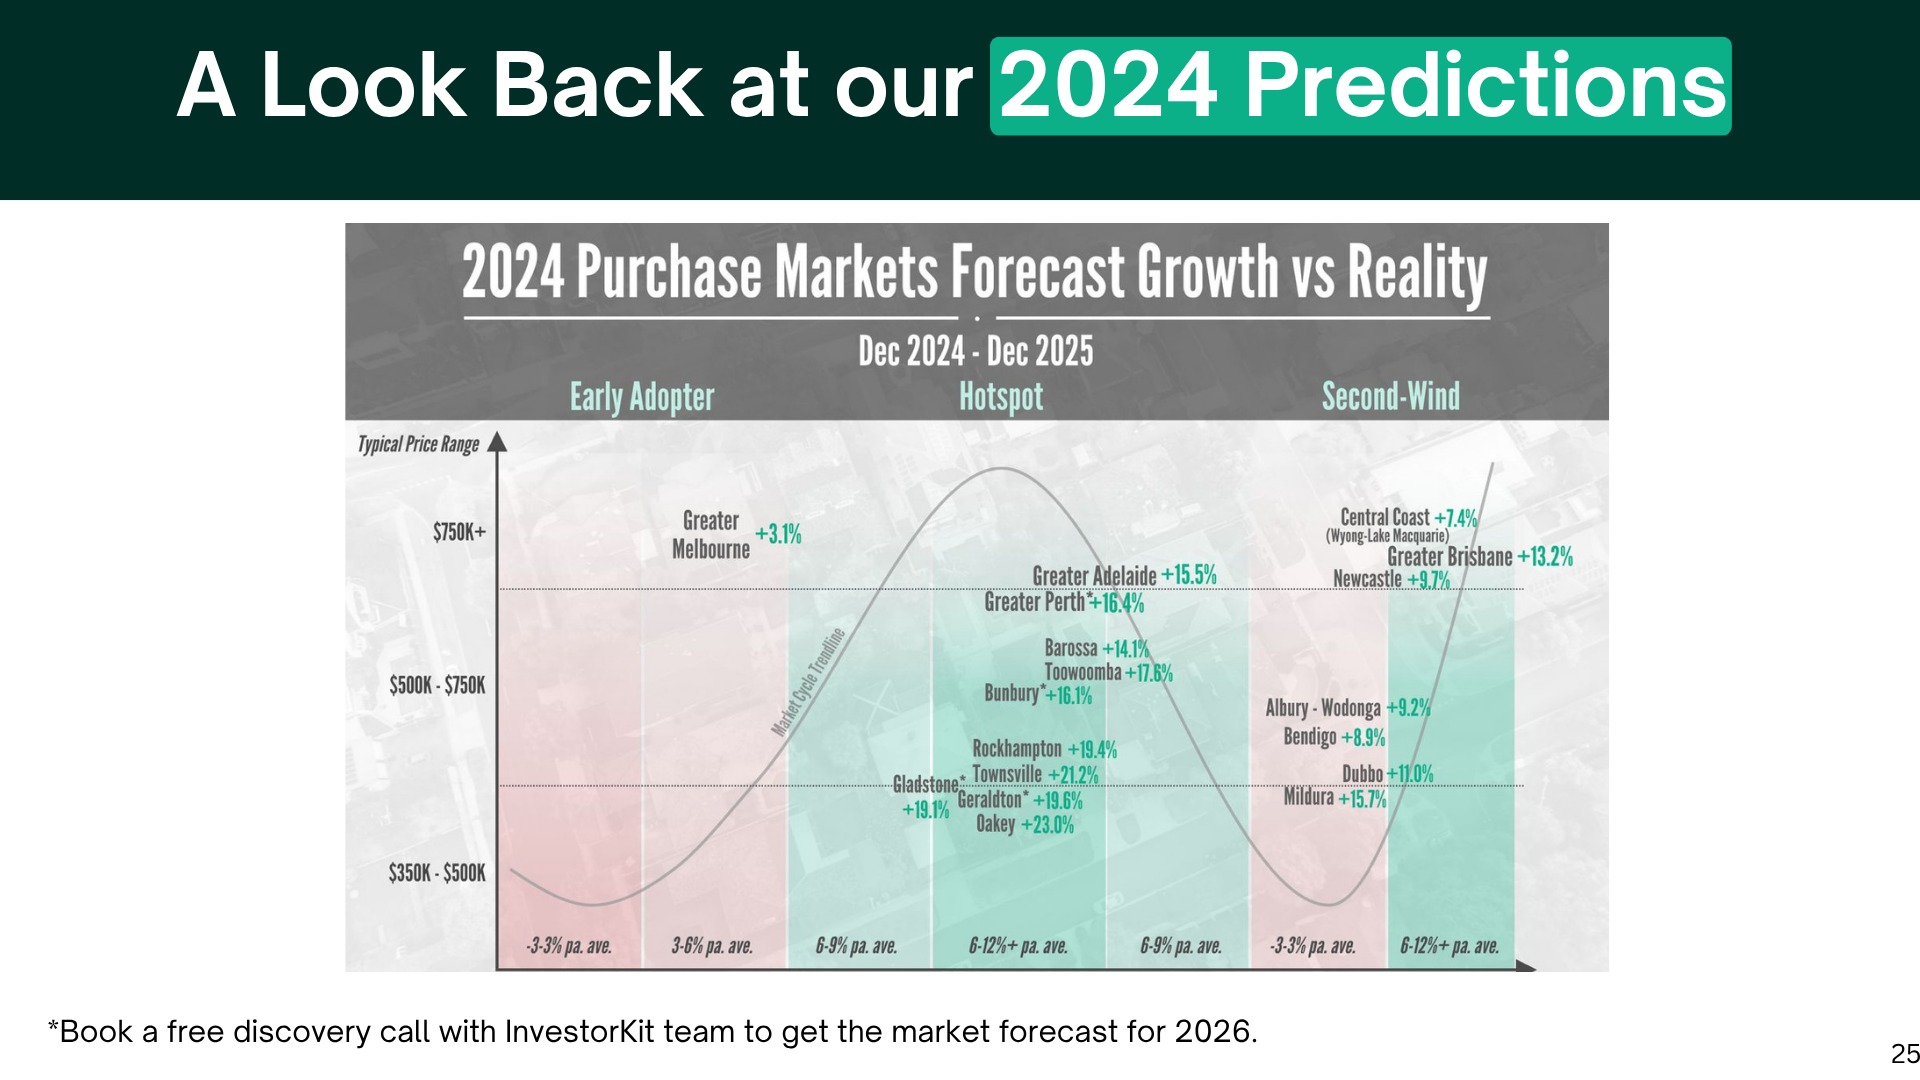
The proof that this framework holds up isn't theoretical. In December 2024, these same market cycle categories were used to forecast what would happen over the following 12 months. Markets flagged as hotspots hit 12%+ growth. Markets flagged as early adopters came in at 3–6%. Markets called as slow, like Greater Melbourne at 3.1%, delivered exactly that. The framework predicted not just the outperformers, but also which markets would be quiet, and it was right across the board.
The residential-to-commercial transition: a note on retirement planning
One exchange from the Q&A is worth highlighting separately, because it applies to a lot of investors who are further along in their journey.
Residential property is a growth asset. It builds wealth well. But yields don't keep pace with prices over time, which means that by the time you reach or approach retirement, you can find yourself holding assets that are highly valued on paper but generating relatively modest income after accounting for the full cost of ownership.
The question isn't whether residential property works. It demonstrably does. The question is what you do with it at transition time.
Investors with strong equity positions and significant portfolios often benefit from consolidating residential holdings and moving into commercial property, which offers yields of 5–7% net, long lease terms, and fewer ongoing management demands. The trade-off is that entry requires more capital, and the buyer pool is narrower.
The point: your portfolio strategy in accumulation phase should be different from your strategy in retirement. Building wealth and generating income are different problems that need different tools. Getting clear on which phase you're in helps you make better decisions about what to buy next, and what to hold or sell.
Using equity to stay in motion
The session covered a lot of ground on how to identify and access growth markets. But there's a practical obstacle that sits underneath all of it: having the capital to act when the opportunity is there.
In a higher-rate environment, cash flow is under more pressure. Refinancing to access equity involves paperwork, credit checks, and a timeline measured in weeks. By the time the process is done, the opportunity has often moved.
This is where Futurerent comes in. If you have equity in an investment property, you can cash out up to $100,000 per property, without refinancing, without affecting your credit score or existing mortgage, and with funds in your account in 2 business days. The advance is settled through a fixed portion of your rental income over 3 years, not from your wallet.
For investors who've done the work of identifying the right market and the right asset, having capital ready to move is often what separates the ones who act from the ones who watch. Find out what you can access here.
If you would like to explore working with Arjun and the InvestorKit team on your portfolio strategy, you can book a free discovery call here: investorkit.com.au


