Australia's property market has delivered its strongest quarterly performance in over a year, with dwelling values rising 0.6% nationally in July – marking the sixth consecutive month of gains, according to fresh data released today by Cotality's latest Home Value Index. What makes this particularly significant is that every capital city recorded price increases, led by Darwin's impressive 2.2% rise and Perth's solid 0.9% gain.
The broad-based recovery comes as auction markets continue to strengthen, with clearance rates hitting 74.7% (a 12-month high) while auction volumes jumped 14% to 1,774 scheduled properties. This momentum is building just as underlying inflation falls to 2.7%, its lowest level since 2021, virtually guaranteeing the RBA will cut rates again in August.
Brisbane is now within striking distance of the $1 million median milestone, sitting at $934,623 after 7.3% annual growth, while Melbourne shows clear signs of recovery with its fastest quarterly gains in years. Meanwhile, critical supply constraints persist, with national listings tracking 19% below the five-year average even as sales remain 1.9% above historical norms.
Key Highlights
- National dwelling values rose 0.6% in July – sixth straight month of gains following February rate cut
- Every capital city recorded dwelling value increases, led by Darwin (2.2%) and Perth (0.9%)
- Auction clearance rates hit 74.7% – a 12-month high with 1,774 scheduled auctions (up 14%)
- Brisbane approaches $1M median at $934,623 with 7.3% annual growth – highest among capitals
- National listings 19% below five-year average while sales track 1.9% above historical norms
- House-unit price gap hits record 32.3% difference, equivalent to $223,000 in dollar terms
- Underlying inflation falls to 2.7% – lowest since 2021, cementing August rate cut expectations at 100%
- APRA maintains 3% mortgage serviceability buffer despite mounting political pressure for easing
This week's data confirms the positive trend in housing values is being supported by persistently low inventory levels and demonstrated buyer demand, creating conditions that continue to favour property owners as we head into the traditional spring selling season.
Godfrey Dinh, CEO of Futurerent, sees this as a validation of market fundamentals: "We're seeing the convergence of multiple positive factors – every capital gaining simultaneously, auction clearances at 12-month highs, and inflation now firmly in the RBA's target range. When you combine this with ongoing supply constraints and 19% fewer listings than historical averages, it creates a compelling environment for property investors who understand the structural dynamics at play."
Broad Recovery
Sixth Consecutive Month of National Gains
Australia's property market has maintained remarkable consistency, with the 0.6% national dwelling value increase in July matching the growth rate of the previous two months. This steady momentum represents a significant shift from the volatility seen in previous cycles.
The positive inflection that began with February's first rate cut has now delivered six consecutive months of gains, creating what analysts describe as a sustainable growth trajectory rather than the boom-bust cycles that have characterised previous periods.
Every Capital Participating in Growth
For the first time in years, every capital city recorded dwelling value increases through July, signalling a genuine broad-based recovery. This universal growth suggests the current cycle has strong underlying fundamentals supporting it.
Darwin led the charge with a substantial 2.2% rise, followed by Perth's robust 0.9% gain.
Even the markets that have struggled in recent years showed positive momentum. Melbourne recorded a 0.4% increase, while Hobart managed 0.1% growth. The ACT posted a respectable 0.5% gain, demonstrating that the recovery extends beyond the traditional powerhouse markets.
Quarterly Performance Reaches New Heights
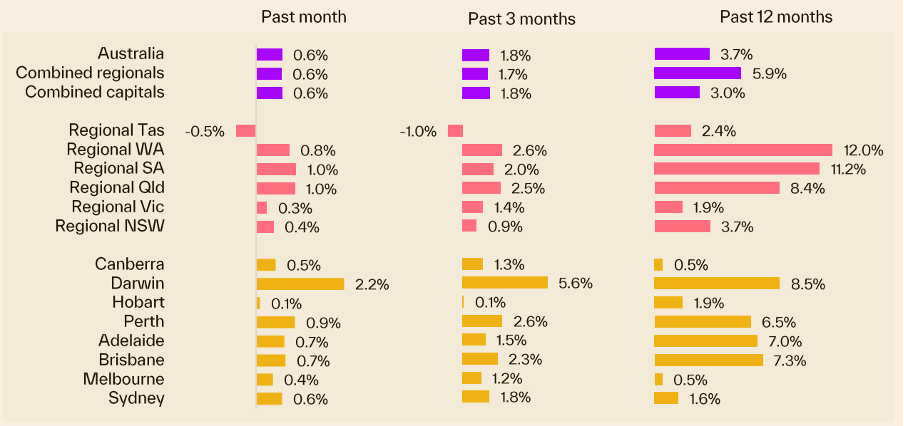
The rolling quarterly change delivered a 1.8% rise in the national index over the three months ending July representing the strongest outcome since the three months ending June 2024, when values rose 2.0%.
Change in dwelling values to end of July 2025
City Performance
Darwin and Perth Lead the Charge
Darwin's 2.2% monthly increase has established it as the standout performer among capital cities, demonstrating the ongoing appeal of markets that offer relative affordability combined with strong fundamentals.
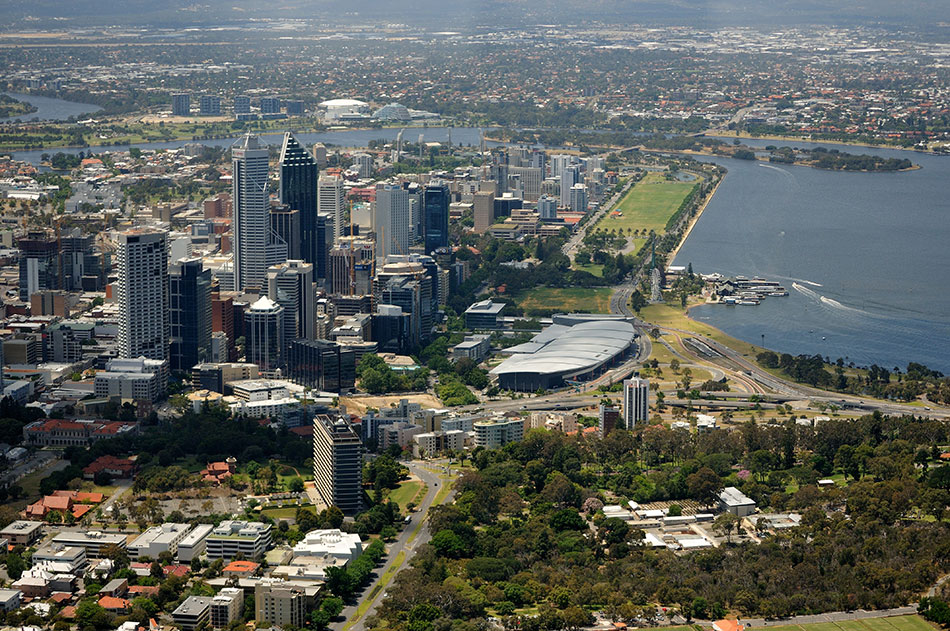
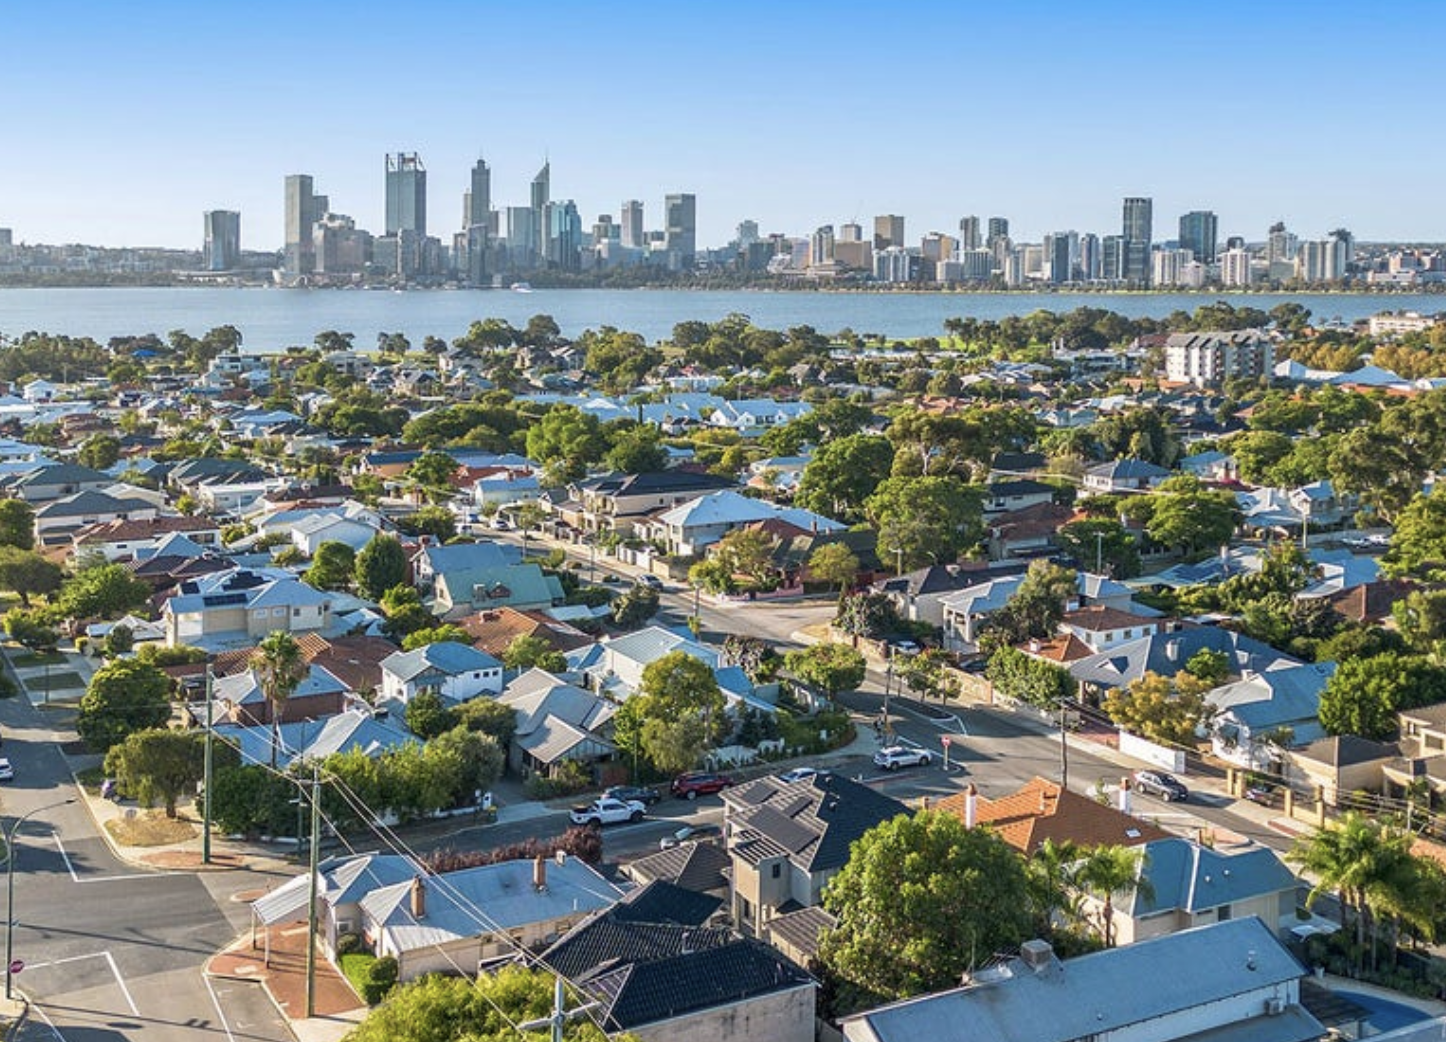
Perth's 0.9% gain continues its impressive run, though the pace of growth has moderated from the levels seen in previous quarters. This moderation suggests the market is transitioning to a more sustainable growth trajectory after its initial catch-up phase.
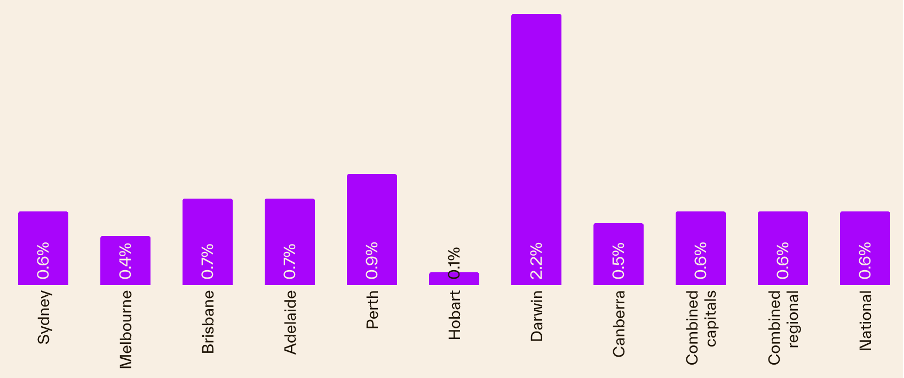
Monthly change in dwelling values - major cities (as of 31 July 2025)
Brisbane Approaches Million-Dollar Milestone
Brisbane's median home value has reached $934,623, representing the highest annual price growth among combined capital cities at 7.3%. The city is now the closest to reaching the $1 million median for all dwellings – a milestone that only Sydney has previously surpassed.
"We could see the Brisbane housing market getting close to the million-dollar median mark in about nine or 10 months." - Tim Lawless, Cotality
This projection places Brisbane on track to join Sydney in the exclusive million-dollar median club, reflecting the ongoing appeal of Queensland's capital for both lifestyle and investment purposes.
Sydney and Melbourne Show Recovery Signs
Sydney's dwelling values rose 0.6% in July, with annual growth now sitting at 1.8% as the market recovers from earlier falls. While this represents more modest growth compared to other capitals, it indicates stability has returned to Australia's most expensive market.
Melbourne's 0.4% monthly gain may appear modest, but it represents significant progress for a market that has struggled in recent years. The Victorian capital's annual growth of 0.5% suggests the worst of its correction may be behind it, particularly as affordability improves relative to other major cities.
"In Melbourne, there's a dual aspect, buyers are reacting to the reduction in the cash rate but also an undervalued market." - Dr Nicola Powell, Domain Chief of Research and Economics
Another increase of $29,000 in Melbourne's median house price would see the city pass the peak it reached in December 2021, at the height of the COVID property boom.
Auction Strength
Clearance Rates Hit 12-Month High
Auction markets delivered their strongest performance in a year, with the preliminary clearance rate rising to 74.7% – the highest level since the first week of July 2024. This result was based on 1,303 results recorded from 1,774 scheduled auctions.
The 14% increase in scheduled auctions to 1,774 from the previous week's 1,561 represents significant momentum building in the market, particularly considering this occurred during what is typically a quieter winter period. However, volumes remain below the same week in 2024, when 1,975 homes went to auction at a time when buyers had no hopes of imminent rate reductions.
This comparison highlights how current buyer confidence is being driven more by rate cut expectations than by overall market exuberance, suggesting a more measured and sustainable recovery trajectory.
"Buyers who are confident of lower borrowing costs in the near future have lifted the preliminary clearance rate to 74.7 per cent, a 12-month high, while auction volumes have also picked up. The result points to a strong spring market as the upturn in the east coast market takes hold." - Louis Christopher, SQM Research
State-by-State Auction Performance
Melbourne maintained its strong performance with a preliminary clearance rate of 76.3%, virtually unchanged from the previous week's 76.7%. However, the number of scheduled auctions jumped significantly to 837 from 671, indicating growing vendor confidence in the Victorian capital.
Sydney's preliminary clearance rate ticked back to 73.8% from 74.8% the previous week, but the harbour city maintained its streak of seven consecutive months above the strong 70% threshold, demonstrating sustained buyer demand.
Brisbane posted an impressive preliminary clearance rate of 74.5%, up from the previous week's 68.4%, while Adelaide saw its rate slip to 69.1% from 71.7%. The ACT showed strong improvement, jumping to 73.7% from 65.8%.
Market Psychology and Rate Cut Expectations
The strength in auction markets reflects growing buyer confidence as rate cut expectations solidify. However, the market has shown some sensitivity to the RBA's timing decisions.
"The Reserve Bank's decision to hold the cash rate at 3.85 per cent this month, rather than cut it as money markets and consumers had expected, hit buyer momentum. We've experienced a slight shift in buyer behaviour, with hesitancy in bidding returning in some markets." - David McMahon, Ray White Head of Auctions NSW and ACT
Despite this temporary hesitation, the underlying strength of auction results suggests buyers remain optimistic about future rate reductions and are positioning themselves ahead of what many expect to be a competitive spring season.
Supply Imbalance
Scale of Australia's Housing Crisis
Australia's housing shortage continues to worsen, with multiple independent analyses confirming the severity of the crisis. The nation is tracking to fall 262,000 homes short of its five-year target, but research suggests the problem may be even more acute.
AMP estimates there is already an existing housing shortfall of between 200,000 to 300,000 homes, while research commissioned by the Property Council of Australia suggests the government could fall 462,000 homes short of its 1.2 million target by 2029. The Urban Development Institute of Australia warns that capital cities alone will be at least 400,000 homes short by 2029.
Migration Impact on Housing Demand
Australia's housing shortage has been significantly exacerbated by record migration levels. Net overseas migration peaked at 446,000 in 2023-24, with research by economist Kevin You showing that migration was responsible for 81% of Australia's population growth between 2022 and 2024.
This migration surge alone created a housing supply shortfall of 179,287 homes between 2022 and 2024, adding substantial pressure to an already constrained housing market. While net overseas migration is now moderating, it remains very high in historical terms and compared to similar OECD countries.
Construction and Planning Bottlenecks
The supply shortage extends beyond immediate listings to fundamental construction capacity issues. Construction timelines have deteriorated dramatically, creating additional bottlenecks in housing delivery. The average freestanding house now takes 12.7 months to build, compared to just nine months in 2010. For apartments, the situation is even more concerning, with build times blowing out by 80% from 18.5 to 33.3 months.
Planning system productivity has also collapsed, with analysis suggesting an average town planner now assesses just 9 dwellings per year compared to 54 dwellings in 1986 – a devastating decline in efficiency that contributes significantly to supply constraints.
Rising construction costs continue to impede housing delivery, with Cotality's Cordell Construction Cost Index showing a 0.5% increase in the June quarter, up from 0.4% in March. Annual construction cost growth has accelerated to 2.9% from 2.6% in the previous year.
"With the cost of building a new home continuing to rise, the stretch target of building 1.2 million new homes by July 2029 is looking harder and harder. Builders are struggling with feasibility assessments amid a combination of high material and labour costs." - Tim Lawless, Cotality
Housing Accord Shortfall
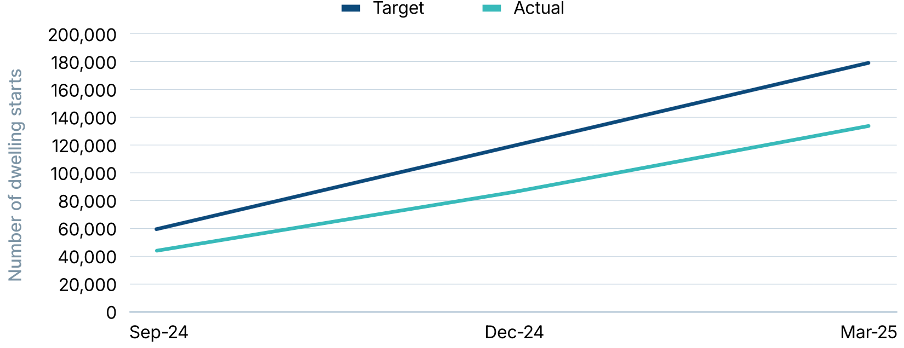
Current data shows only 134,466 new dwellings were commenced in the first three quarters of the 2024/25 financial year – 45,534 or 25% less than the 180,000 homes required to stay on track with targets.
Australia is not approving, commencing or completing new homes at a sufficient rate to meet Housing Accord targets
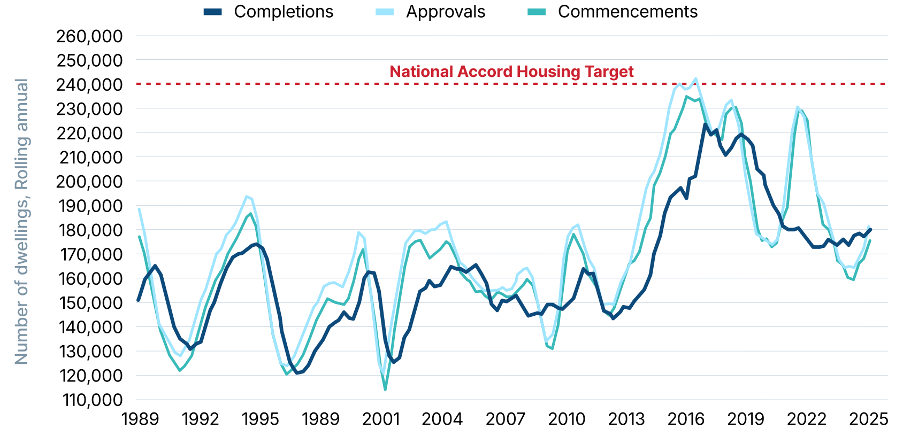
"Since the commencement of the Housing Accord, just 134,466 new dwellings have commenced. To stay on track, we would need around 60,000 starts per quarter -- we are about 25% short of that pace." - Denita Wawn, Master Builders CEO
These structural inefficiencies and cost pressures suggest that even with policy support, addressing the housing shortage will require fundamental reforms to planning and construction processes, providing ongoing support for property values in the meantime.
Cumulative Housing Accord Target Commencement vs Actual
Rate Environment
Inflation Falls to Target Range
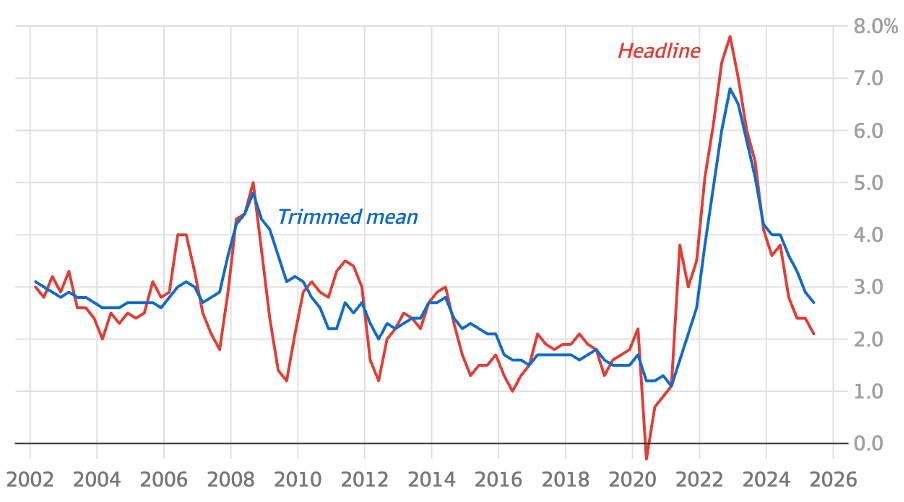
The June quarter inflation outcome has delivered exactly what the RBA needed to justify further rate cuts. The quarterly trimmed mean came in at 0.6%, with annual core inflation reducing to 2.7% – the lowest reading since September 2021.
This result places inflation firmly within the RBA's 2-3% target range and significantly below the levels that prompted the aggressive rate hiking cycle that began in 2022.
Underlying inflation was 0.6% for the three months and 2.7% for the 12 months to June 30. While this was slightly above the RBA's forecast of 2.6%, it was still down from 2.9% in the March quarter, confirming the disinflationary trend.
Annual inflation (%)
August Rate Cut Now Near Certain
Money market pricing has moved to 100% probability of an August rate cut, up from 92% before the inflation data release.
"The RBA monetary policy board in July opted to wait for more confirmation that inflation is on track to return to the midpoint of the 2-3 per cent target range and stay there. That confirmation has now come with the full June quarter CPI data. We therefore expect the RBA to cut rates by 25 basis points at its August meeting, to 3.6 per cent. Further cuts in November, February 2026 and May 2026 also look increasingly likely." - Luci Ellis, Westpac Chief Economist
This clear path for multiple rate cuts provides a supportive backdrop for continued property price growth through the remainder of 2025 and into 2026.
Consumer Sentiment and Borrowing Capacity
The prospect of lower interest rates is already flowing through to improved consumer sentiment and borrowing capacity. Domain reports that borrowing power has increased by about 5% since January, helping to drive renewed buyer activity.
"Lower interest rates go well beyond providing a lift to home loan serviceability and borrowing capacity. We expect to see a further rise in consumer sentiment as cost-of-living pressures are contained and the cash rate moves lower. Historically, consumer sentiment and housing activity have shown a close relationship." - Tim Lawless, Cotality
Lending Landscape
APRA Maintains Serviceability Buffer
The Australian Prudential Regulation Authority has announced it will maintain the current 3% mortgage serviceability buffer, rebuffing political pressure and calls from banks to ease lending criteria. This decision affects borrowers' ability to access credit and will influence the pace of market recovery.
"High household debt is a key vulnerability in our financial system, which has more exposure to residential mortgages than any comparable country. Although lending standards are currently sound, it's important to be forward-looking and prepared for potential risks at future points in the financial cycle." - John Lonsdale, APRA Chair
Independent housing analyst Cameron Kusher believes this tough stance reflects deeper concerns about the property market's trajectory:
"APRA is very aware that the fall in interest rates is likely to push property prices higher and they see that as a key potential vulnerability when household debt levels are already elevated." - Cameron Kusher, Independent Housing Analyst
The regulator's decision reflects concerns about elevated household debt levels and the potential for risky lending practices as financial conditions ease. However, this creates strategic opportunities for investors with alternative funding sources.
Godfrey Dinh, CEO of Futurerent, sees this regulatory stance as creating market advantages: "With APRA maintaining the 3% serviceability buffer despite political pressure, we know borrowing capacity will remain constrained even as rates fall. This creates opportunities for investors who can access alternative funding to move quickly while others wait for traditional finance approvals."
Non-Bank Lenders and Broker Influence
Research from PEXA shows the banking sector is experiencing significant structural changes that could benefit borrowers. While the number of customer-owned banks has fallen 84% over the past 20 years, non-bank lenders are gaining ground, particularly among borrowers who don't fit traditional bank profiles.
Mortgage brokers now play a dominant role in the market, sourcing over 50% of the aggregate value of new mortgages. This trend particularly benefits smaller and foreign-owned banks, with some receiving over 75% of their loans through broker channels.
The major banks continue to dominate overall lending volumes, with the big four approving approximately 190,000 new loans across NSW, Victoria, and Queensland in the 2024-25 financial year – representing a 3.9% increase from the previous year.
Technology Driving Competition
Digital systems are speeding up the mortgage process and helping smaller lenders compete more effectively with major banks. PEXA's digital tools are reducing settlement times and paperwork, creating more opportunities for non-major banks to compete.
This technological advancement, combined with falling interest rates, is reshaping the competitive landscape and potentially improving outcomes for borrowers seeking property finance.
Market Outlook
Positive Fundamentals Support Growth
The outlook for housing values remains positive, supported by an environment of lower interest rates, improving sentiment, and persistent housing supply shortages. The combination of these factors creates a foundation for continued modest growth through the remainder of 2025.
"On balance, the tailwinds of lower interest rates, higher confidence and low housing supply are likely to outweigh the headwinds, providing the foundations for further modest growth in housing values in 2025." - Tim Lawless, Cotality
With core inflation now firmly around the mid-point of the RBA's target range, there is clear expectation that interest rates will reduce further, providing ongoing support for property values.
Policy Implications and Affordability Concerns
While governments have introduced various first home buyer assistance programs, including shared-equity and deposit guarantee schemes, these initiatives may be counterproductive in a supply-constrained environment.
Independent economist Saul Eslake warns of unintended consequences:
"Giving money to people to spend on housing that they otherwise wouldn't have, results in a supply-constrained market ... and people paying more for housing." - Saul Eslake, Independent Economist
This analysis suggests that without matched increases in housing supply, demand-side assistance programs risk exacerbating affordability challenges by driving up prices in the affordable end of the market – precisely the segment these policies aim to help.
Regional Market Dynamics
Regional markets are no longer outperforming capital cities overall, with combined July quarterly growth of 1.7% compared to capitals' 1.8%. However, regional Victoria (1.4%), Queensland (2.5%), and South Australia (2%) still outperform their capital city counterparts.
"There had been migration into regional areas was returning to normal after the surge during the pandemic period." - Tim Lawless, Cotality
This normalisation suggests the pandemic-driven regional boom has run its course, with growth patterns returning to more traditional capital city focus.
The persistent supply-demand imbalance, combined with rate cuts beginning to flow through to borrowing capacity, creates a window for investors to secure properties before competition intensifies further during the spring selling season.
Strategic Implications
Investment Opportunities in Current Environment
The persistent supply-demand imbalance, combined with rate cuts beginning to flow through to borrowing capacity, creates a window for investors to secure properties before competition intensifies further during the spring selling season.
Timing Considerations
With auction clearance rates at 12-month highs and every capital participating in growth, the market is showing clear signs of strength. However, listing volumes remain 19% below historical averages, suggesting opportunities exist for buyers willing to move decisively.
The certainty around August rate cuts, combined with expectations for further easing through 2025, provides a supportive backdrop for property investment decisions. Early positioning ahead of anticipated spring market activity could prove advantageous.
Focus Areas for Investors
The record 32.3% price gap between houses and units suggests opportunities in the apartment sector, particularly for yield-focused investors. Brisbane's approach to the $1 million median milestone indicates continued strength in Queensland's capital.
Melbourne's recovery signs, combined with its relative affordability compared to Sydney, present compelling value propositions for investors seeking both capital growth potential and rental yields in Australia's second-largest city.
How Futurerent Can Help
Property investors know that prices grow faster than you can save. And even with a foot on the property ladder, taking the next step shouldn't mean asking the bank's permission or signing up to another lifetime of interest when all you need is to unlock what's already yours.
What if you could access that equity without refinancing, selling the property, or waiting until it's too late?
That's why investors turn to Futurerent - to unlock their equity without the usual trade-offs. There's no refinancing, no painful paperwork, and no impact on your credit score.
Futurerent helps investors cash out up to $100,000 per property, with funds in your account in just 2 business days. The property returns the cash out from a fixed portion of the rent over 3 years.
With market conditions suggesting significant opportunities ahead, having quick access to capital could make all the difference in securing your next investment before prices potentially move higher.