Australian national property values jumped 0.8% in September 2025, the strongest monthly gain since October 2023, pushing the median to $857,280. Severe supply constraints - with listings 20% below average and construction approvals 51,000 units short annually - are colliding with strengthening demand as investor credit growth hits 6.6%. Layering on top of this, the expanded First Home Buyer Guarantee launched October 1st to unprecedented uptake. This spring trifecta of supply shortage, investors returning, and scheme-driven demand is set to drive accelerated market conditions across Australian property markets.
Growth Acceleration
Australia's property market delivered its strongest monthly result in nearly two years through September, with the 0.8% national gain representing a clear acceleration in price momentum as the convergence of rate cuts, expanded buyer schemes, and traditional spring activity reshapes market dynamics.
The $857,280 national median dwelling value marks an $18,215 increase over the September quarter, demonstrating the accelerating trajectory that began with February's first rate cut. Quarterly growth of 2.2% represents a substantial lift from the 1.5% recorded in the June quarter and double the 1.1% gain seen in March, indicating momentum is building rather than plateauing.
September's performance coincides with the October 1st launch of the expanded First Home Buyer Guarantee, which has already generated what mortgage brokers describe as unprecedented demand. The scheme's removal of income caps and dramatic increase in price limits has brought 70,000 additional eligible buyers into the market, creating intense competition in entry-level segments.
Tim Lawless, research director at Cotality, captures the current dynamic: "It is a classic case of demonstrated demand continuing to outweigh available supply, and it looks like some further momentum is probably going to build in the market”.
Key Highlights
- National dwelling values rose 0.8% in September – strongest monthly gain since October 2023 and eighth consecutive month of growth
- Quarterly growth accelerates to 2.2% ($18,215 increase) from 1.5% in June quarter and 1.1% in March quarter
- Darwin leads capitals with 1.7% monthly growth, followed by Perth 1.6% and Brisbane 1.2%
- First Home Buyer Guarantee launched October 1st with unprecedented demand, 70,000 eligible in first year
- Critical supply shortage continues with listings 20% below average at 121,000 vs typical 150,000 properties
- Extreme listing shortages: Darwin listings down 53%, Perth down 45%, Brisbane down 31%
- Investor credit growth grows to 6.6% annually, overtaking owner-occupier growth of 5.7% since April
- National rental vacancy hits record low 1.4% with quarterly rent growth of 1.4% (highest since June last year)
- "Granny flat" overtakes "pool" as Sydney's top property search term, with dual-income searches up 166% in Melbourne and 80% in Sydney
- RBA holds cash rate at 3.6% as inflation rises to 3% from 2.7%, creating uncertainty around November cut
Momentum Builds
September's 0.8% monthly growth represents the strongest performance since October 2023, marking a clear inflection point in the current cycle as multiple demand drivers converge with persistent supply constraints.
The quarterly acceleration tells the momentum story. The 2.2% gain through the September quarter compares to 1.5% in June and 1.1% in March, demonstrating that price growth is strengthening rather than moderating as spring activity builds. This $18,215 quarterly increase in the national median takes dwelling values to $857,280.
Change in median house prices, September (%)
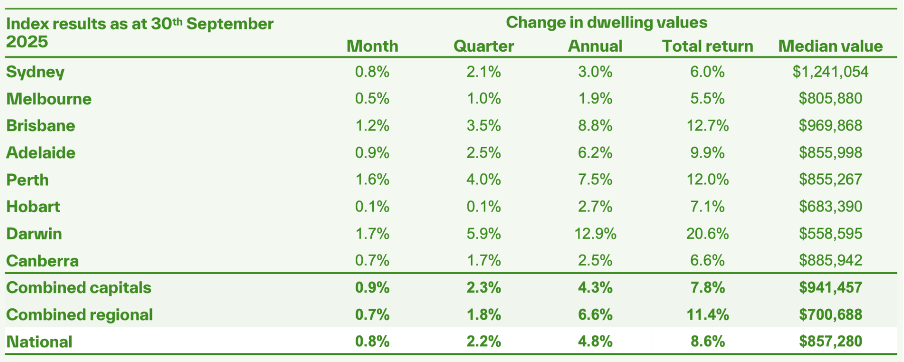
Darwin led capital city growth with a substantial 1.7% monthly increase, followed by Perth's 1.6% and Brisbane's 1.2%. These results occurred against a backdrop of historically low listing levels, with Darwin experiencing a 53% shortage, Perth down 45%, and Brisbane tracking 31% below average inventory.
Sydney recorded a solid 0.8% monthly gain, adding $9,700 to the median dwelling value. The harbour city's performance demonstrates resilience despite stretched affordability, with Lawless noting: "The fact that we're still seeing Sydney so strong speaks to its resilience as a housing market, and probably that there's something invisible that's supporting demand, such as the bank of mum and dad."
The strength of underlying demand is evident in sales activity, which continues tracking 4% above the previous five-year average despite affordability constraints and limited stock availability. This suggests genuine buyer commitment rather than speculative activity driving current conditions.
First Home Buyer Guarantee Impact
The expanded First Home Buyer Guarantee launched October 1st with immediate market impact, as mortgage brokers report unprecedented demand from buyers newly eligible under the scheme's revised parameters.
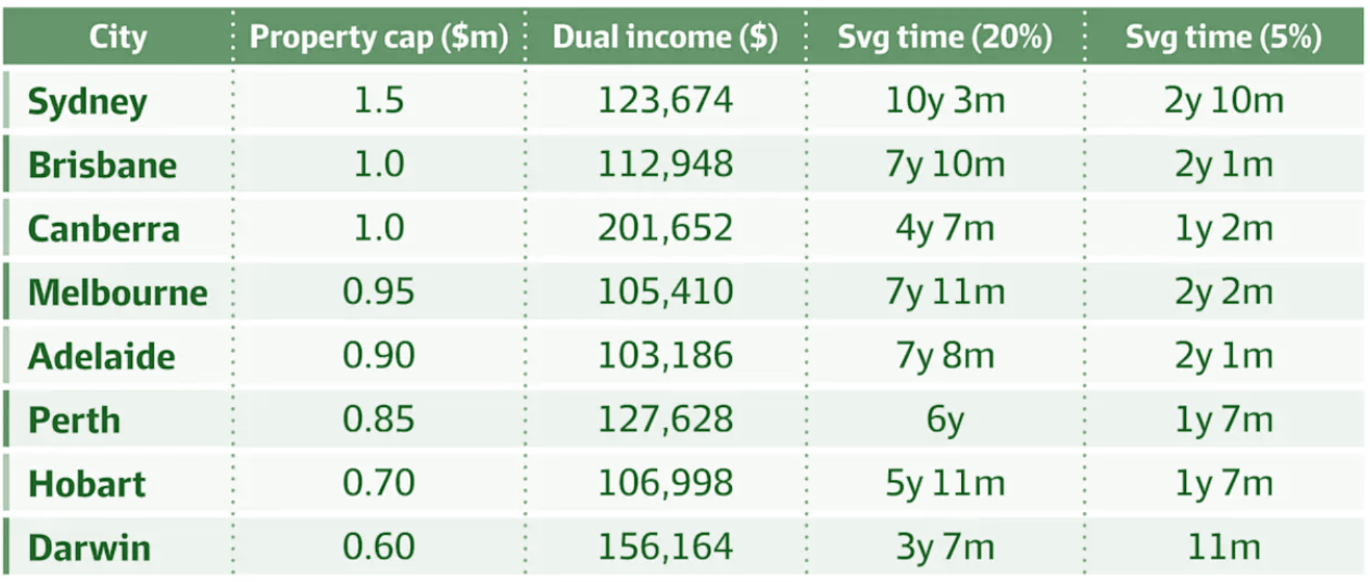
The policy changes are substantial. Income caps have been abolished entirely, removing the previous $125,000 limit for singles and $200,000 for couples. Price caps have increased dramatically across all capitals: Sydney's cap has been raised from $900,000 to $1.5 million - a $600,000 increase. Melbourne's cap has been lifted by $150,000 to $950,000, while Brisbane has seen a $300,000 increase to $1 million. Canberra's new price cap sits at $1 million, Adelaide at $900,000, Perth at $850,000, Hobart at $700,000, and Darwin at $600,000. These increases represent the most significant expansion of the scheme since its introduction, dramatically widening the pool of eligible properties across every Australian capital city.
Treasury estimates 70,000 people will become eligible in the first year, up from the previous maximum of 50,000 annual places. The scheme enables buyers to purchase with just a 5% deposit without paying lenders' mortgage insurance, which typically costs between $5,000 and $30,000.
Sydney eastern suburbs mortgage broker James Watson reported immediate impact: "There is unprecedented demand and people are literally queuing up to submit the application. I had already submitted three applications on the first day of the expanded program, and I would process dozens more over coming weeks."
Watson identifies the timing advantage for early movers: "It's really only going to benefit the first movers because I think prices are going to adjust higher given the amounts of people who are inquiring."
Nicola Powell, chief of research and economics at Domain, sees clear price implications: "We're going to see higher prices for more affordable homes from this first home buyer incentive. The demand-side policy would bid up prices for apartments and houses in the outer suburbs."
The scheme's structure creates particular pressure on entry-level segments, with implications for both first buyers and investors targeting these price points.
"The removal of income caps fundamentally changes the competitive landscape," notes Godfrey Dinh, CEO of Futurerent. "Previously, high-income earners were excluded from the scheme. Now, a couple earning $300,000 combined can access the same benefits as those on modest incomes. But it's not just the 5% deposit - the $5,000 to $30,000 LMI savings dramatically amplifies buying power, meaning these 70,000 new participants are entering with significantly more firepower than the market anticipates.
"The uneven cap increases will create geographic distortions. Sydney's $600,000 increase versus Melbourne's $150,000 lift means we'll see vastly different competitive dynamics across capitals. In suburbs sitting just below these thresholds - your Marsfields, your Keperras - you're going to see first-time buyers, investors, and upgraders suddenly competing for the same properties. What Treasury won't tell you is that a scheme designed to improve affordability will accelerate gentrification in these entry-level pockets and drive prices higher in the very segments it aims to help. Therefore, first movers will gain the dual advantage of lower entry prices and accelerated capital growth."
Entry-Level Price Acceleration
Analysis of the scheme's likely market impact reveals potential for substantial price increases in segments just below the new price caps, with predictions ranging from modest to significant depending on timeframe and methodology.
Treasury's official modelling suggests a 0.5% to 1% overall price increase nationally. However, independent analysis by Lateral Economics for the Insurance Council of Australia estimates the scheme could increase national property prices by between 3.5% and 6.6% in the first year as it enables between 20,600 to 39,100 buyers to purchase earlier than otherwise possible.
Value tier analysis supports this prediction. Through the September quarter, lower quartile dwelling values rose 2.6%, compared with 2.7% growth across the middle of the market and 1.8% in upper quartile values. This demonstrates entry-level segments are already experiencing the strongest growth, a trend the scheme is likely to amplify significantly.
The distribution of properties relative to price caps reveals where pressure will concentrate. According to Cotality analysis, 93% of suburbs nationally have median unit values equal to or below the scheme's price caps, compared to only 50% of suburbs for houses.
Capital city data shows houses recorded 2.4% quarterly growth compared to 1.7% for units. However, Brisbane stands out as the outlier, with unit values consistently rising at a faster pace than house values over the past seven quarters due to severe supply shortage. Perth and Hobart have also seen unit values outpace houses in the September quarter, though this trend has been less consistent than Brisbane's sustained unit market strength.
Nerida Conisbee, chief economist at Ray White, confirms this view: "The scheme would push up property prices in the bottom 25 per cent of the market that is typically targeted by first buyers. It will lead to faster growth for the more affordable part of the market up to the price point where the 5 per cent scheme cuts out for each capital city."
Properties in suburbs sitting marginally below the price thresholds will experience the most immediate demand pressure. According to Domain's house price data, Marsfield represents the nearest Sydney suburb to the central business district where the median house price remains under $1.5 million. Located 11.5 kilometres from the CBD, this suburb has a median value of $1.425 million.
Domain data shows additional Sydney locations within a 20-kilometre radius of the CBD where median property values fall beneath the threshold. These areas include: Lakemba, Roselands, and Berala (each at $1.4 million); Auburn, Riverwood, and Condell Park (each at $1.3 million); Chester Hill ($1.2 million); and Bankstown, Parramatta, Caringbah, Revesby, and Padstow Heights (all at $1.4 million).
Melbourne offers first-time purchasers more than twelve suburban options within a 10-kilometre distance from the CBD where median house values remain below the $950,000 threshold. Footscray stands as the nearest qualifying suburb to the city centre, situated 3.4 kilometres away with a median price of $900,000.
Additional Melbourne suburbs within 10 kilometres of the city centre that fall below the price threshold include: Maribyrnong (median value $910,000), Maidstone ($776,500), Pascoe Vale ($798,000), Altona North ($930,000), Reservoir ($810,000), Heidelberg West ($773,500), Fawkner ($759,250), Oak Park ($815,000), Hadfield ($828,000), Airport West ($882,500), and Sunshine ($770,000).
For Brisbane, Keperra is the nearest suburb to the CBD where property values sit below the newly established $1 million threshold. This suburb lies 6.6 kilometres from the city centre and has a median house value of $970,000.
Domain data indicates that Brisbane suburbs with median house values under the $1 million threshold within 12 kilometres of the city centre include: Hemmant ($980,000), Arana Hills ($985,000), Oxley ($915,000), Ferney Hills ($992,000), Acacia Ridge ($809,000), Zillmere ($850,000), Boondall ($928,000), Durack ($830,000), Runcorn ($900,000), and Richlands ($737,500).
Lawless predicts these opportunities won't last: "There's a little patch of Sydney, for example, of suburbs that are still within 20 kilometres of the CBD, that have a median house value below the one and a half million mark. I don't think they'll last long."
City and Regional Performance
September's pricing data revealed continued strength in smaller capitals and regional markets, while highlighting Melbourne's relative undervaluation compared to Sydney.
Darwin's 1.7% monthly increase and Perth's 1.6% gain reflect ongoing momentum in markets that offer relative affordability combined with tight supply conditions. Brisbane's 1.2% result maintains the Queensland capital's trajectory toward the symbolic $1 million median milestone.
Sydney's 0.8% monthly gain added $9,700 to the median dwelling value, demonstrating the harbour city's resilience despite being Australia's most expensive market. The result suggests sustained demand despite affordability challenges.
Melbourne presents an interesting opportunity according to market analysts. Lawless observes: "Melbourne is surprising on the downside. You look at the difference in the median value between Sydney and Melbourne, they haven't been this far apart since the middle of 1999. Melbourne is looking undervalued to me, and I'm kind of surprised it hasn't really hit its stride more substantially, given this affordability advantage it has."
This Melbourne-Sydney gap represents the widest valuation difference in over 25 years, suggesting potential for catch-up growth as investors recognise the value proposition.
Regional markets continue outperforming in many areas, particularly across Queensland where lifestyle appeal combines with relative affordability to attract buyers from capital cities. However, the gap between capital and regional performance has narrowed as metropolitan markets strengthen.
Domain's Powell reports: "I'm seeing a lift in buyer inquiries in every capital, which shows buyer confidence is increasing. Interestingly, the lift is being led by Brisbane and Perth, but even some of those cities, like Canberra and Melbourne, that were much more stagnant in prior years have started to see a rebound in interest from buyers."
Granny Flats: The New Investment Priority
A significant shift in buyer preferences reveals changing investment priorities as affordability pressures reshape the Australian property market. According to Domain's 2025 search data, "granny flat" has displaced "pool" from the top position in Sydney property searches for the first time in years. The feature now ranks second in Perth, seventh in Brisbane, and ninth in Adelaide.
Domain’s top five search terms for Sydney property
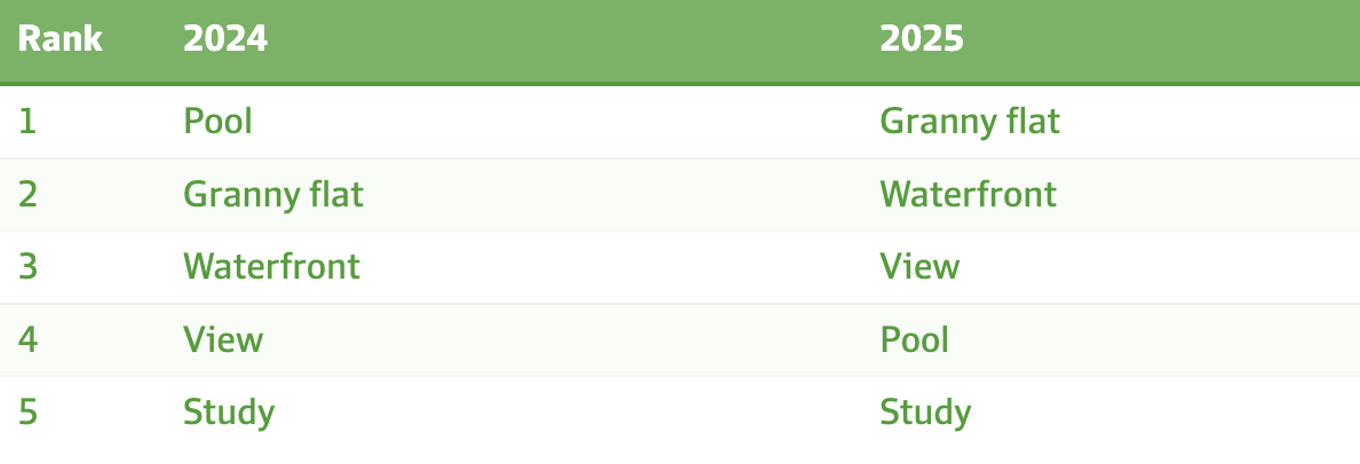
Broader search patterns confirm interest in dual-income solutions. Domain data shows searches for "dual" or "dual living" increased 166% in Melbourne and 80% in Sydney over the past year.
Nicola Powell, Domain's head of research, identifies the financial drivers behind this trend: "I think that buyers are increasingly looking for ways to offset a mortgage and a granny flat obviously provides a rental stream or dual income option. Other things such as multi-generational living … those demographic shifts where we've got adult children living at home for much longer, so the ability to have a home that has a separate space that's self-contained."
The investment fundamentals are compelling. Theodore Stone, chief executive of Melbourne-based Innovista Group, reports construction costs ranging from $160,000 to $250,000, with weekly rental returns in premium Sydney areas like the north shore and northern beaches reaching $1,000.
Development activity supports the growing trend. The Housing Industry Association forecasts granny flat construction nationally will reach 10 times 2022 levels by 2026. In NSW, where approval processes were streamlined in 2008, an average of 4,320 granny flats gained approval annually between 2017 and 2023.
Stone highlights the versatility that distinguishes granny flats in today's market: "Where the fundamental value lies in the humble granny flat is its flexibility. You can choose to rent it out. You can choose to keep it as an asset for your parents. You can choose to keep it as an asset for your kids. Instead of gifting their kids $200,000 as their 20 per cent deposit for their first home, they can choose to invest that money in their own block, secure a little nest egg for their retirement as well."
Stone identifies multiple factors supporting sustained demand: escalating aged care expenses, cost-of-living challenges, rising construction costs, and elevated property prices are extending the period adult children live at home or prompting returns to the family residence.
For investors operating in current conditions - with vacancy at 1.4%, strengthening rental growth, and supply limitations extending into 2027 - properties offering granny flat development potential or existing secondary dwellings provide both enhanced rental yields and capital appreciation opportunities as buyer preference for dual-income configurations intensifies.
Listing Shortage Driving Competition
The supply-demand imbalance that has characterised Australia's property market throughout 2025 continues to intensify, with national listings sitting at 121,000 properties compared to the typical 150,000 expected for this time of year, representing a persistent 20% deficit. Meanwhile, estimates of sales activity through the September quarter tracked 7.3% above the previous five-year average, demonstrating a clear disconnect between supply and demand.
Australian Home listings, national ('000)
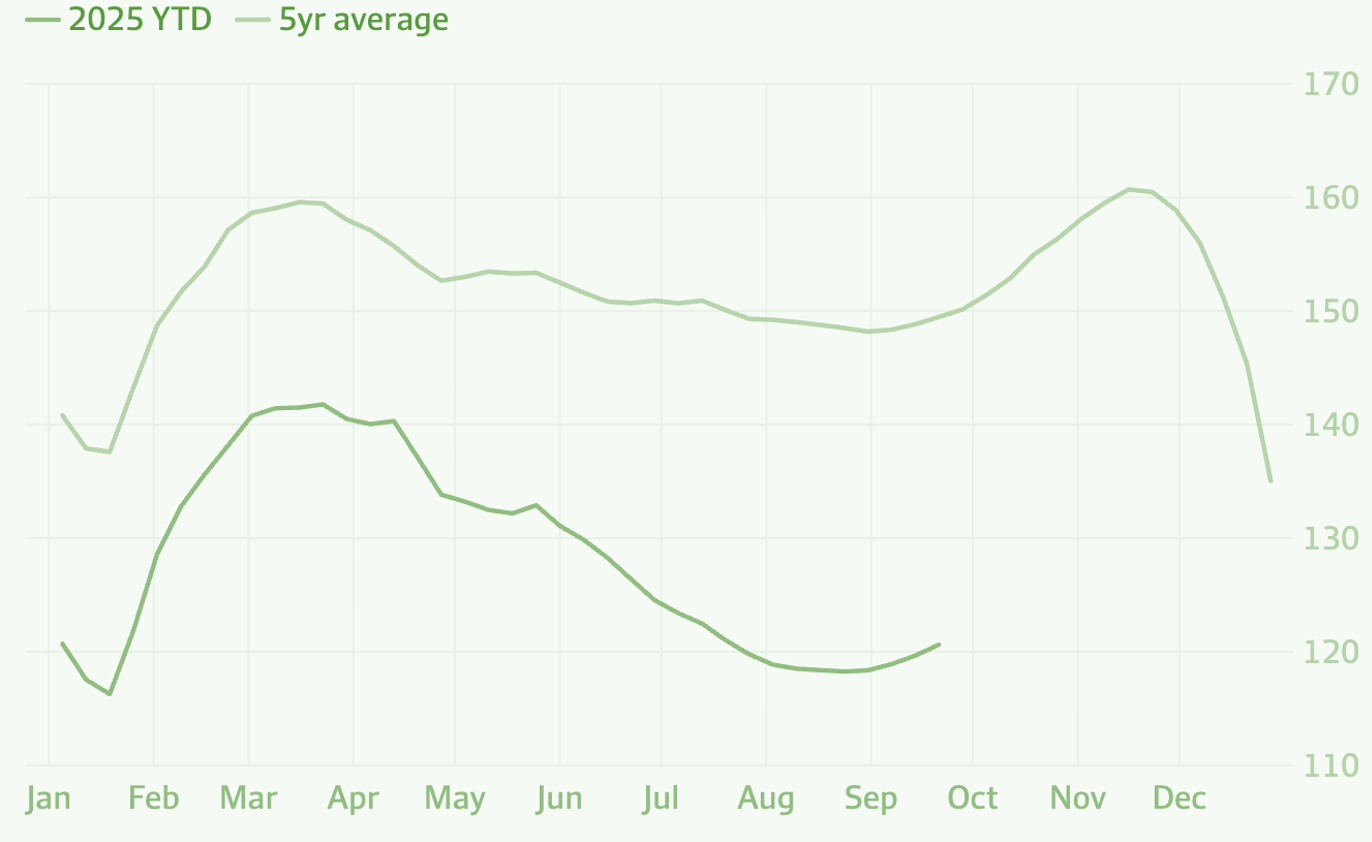
Regional variations in supply shortages are extreme. Darwin faces the most acute constraint with listings 53% below average levels, followed by Perth at 45% below and Brisbane at 31% below typical inventory. These shortages directly correlate with the strongest price growth, as limited stock availability forces buyers to compete more aggressively.
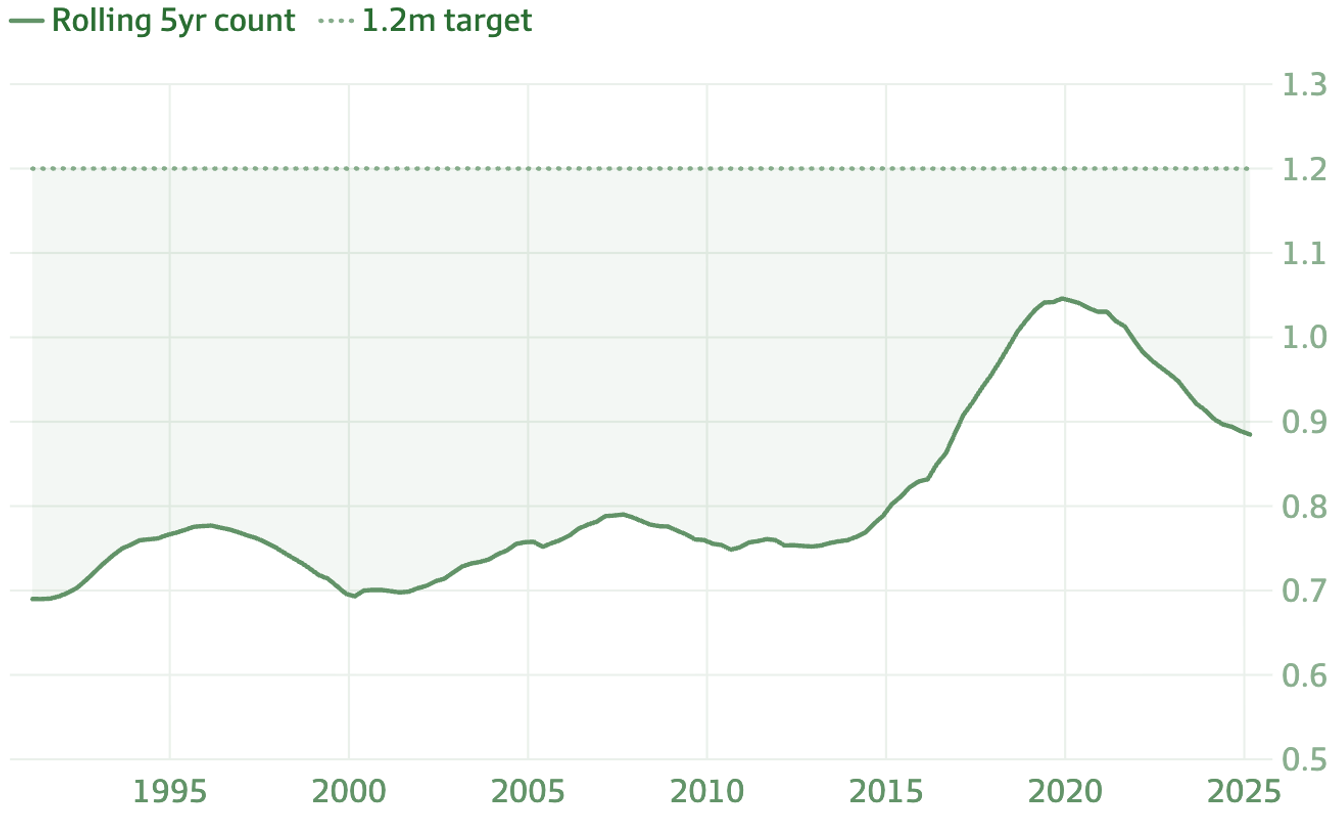
Construction Completion Shortage
The supply crisis extends beyond immediate listing levels to structural construction challenges. In the full year to August, just 189,000 new dwellings received approval, well short of the 240,000 required annually to achieve the government's target of 1.2 million homes over five years.
The fundamental issue represents what economists term a "structural deficit of supply" - an ongoing shortfall where supply consistently fails to meet rising demand. Despite various government initiatives aimed at addressing this gap, Reserve Bank Governor Michele Bullock delivered a sobering assessment to the media, indicating she does not foresee meaningful progress on resolving the supply shortage for at least two years.
"I'm not confident it's going to make any impact in the next two years," Bullock stated, effectively signaling that the current supply constraints will persist well into 2026-2027.
The building activity decline compounds the challenge. Owen notes: "Relatively high interest rates, construction and material costs and strong competition for labour has reduced feasibility, and that's another reason we're likely to see this kind of tightness in the market and a floor under home values."
Australian home build completions, national (million)
Investor Return & Credit Growth
A significant shift in market composition has occurred since April 2025, with investor credit growth overtaking owner-occupier lending growth for the first time in the current cycle.
Housing investor credit growth has accelerated to 6.6% in the year to August, up from 3.9% a year earlier, while owner-occupier lending expands at a more modest 5.7%. This reversal reflects improving investment fundamentals as rate cuts improve serviceability and rental yields remain attractive in a 1.4% vacancy environment.
Queensland has emerged as a particular focus for returning investors. Nerida Conisbee, chief economist at Ray White, confirms: "We have seen investors come back into the market, particularly in places like Queensland."
The RBA has noted the implications of this shift: "While investor lending in Australia has historically had lower default risk than other types of mortgage lending, investor activity tends to drive housing price dynamics to a greater extent than owner-occupier activity."
The return of investor demand adds another layer to the supply-demand dynamic, as this cohort competes with both upgraders and first home buyers for available stock. With listings 20% below average and investor appetite improving, competition for investment-grade properties intensifies.
The timing of this investor return coincides with the First Home Buyer Guarantee expansion, creating potential for increased competition in overlapping market segments, particularly units and entry-level houses that appeal to both investor and first buyer cohorts.
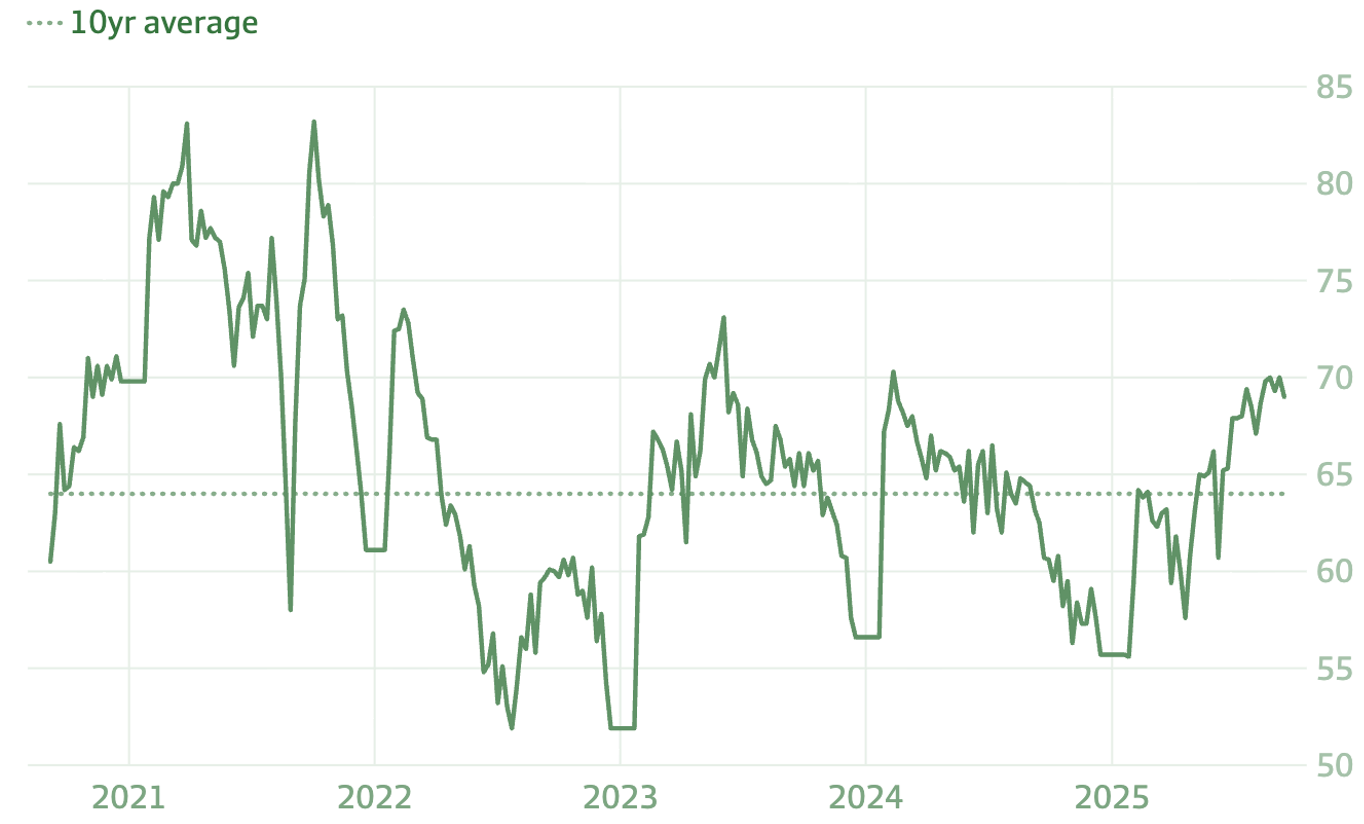
Auction Activity
Weekend auction activity delivered robust results as the expanded First Home Buyer Guarantee brought new participants into the market alongside traditional spring season momentum. The national preliminary clearance rate reached 71.9% despite long weekend disruptions across most states, according to Cotality data.
Ray White chief executive Dan White confirmed immediate market impact from the scheme's expansion: "It's as people expected. [The first home buyers scheme] has had an impact. We're definitely seeing stronger activity from first home buyers, pretty much across the country. They're out there now looking. [The policy] has probably sparked their curiosity, sparked their interest, to really having more confidence to enter the marketplace."
Melbourne drove much of the weekend's activity after the previous week's pause for the AFL grand final. Auction listings in the Victorian capital surged more than fourfold to 1,169 properties, achieving a preliminary clearance rate of 71.6%.
Sydney experienced reduced volumes due to the long weekend and NRL grand final, with listings dropping by more than half. Despite the lower activity, the harbour city recorded a 72.4% clearance rate on the properties that did go to auction.
SQM Research founder Louis Christopher notes the clearance rate strength compared to historical patterns: "That's a sign of a pretty healthy market, one that is somewhat in favour of sellers. Looking at the clearance rates, I would say that prices are definitely still rising, and it is very likely we will have a strong back end of 2025."
Auction clearance rates have been holding around the 70% mark since mid-August, up from an average of roughly 63% through the June quarter and 62% in the three months to March.
Australian 10 year average auction clearance rates
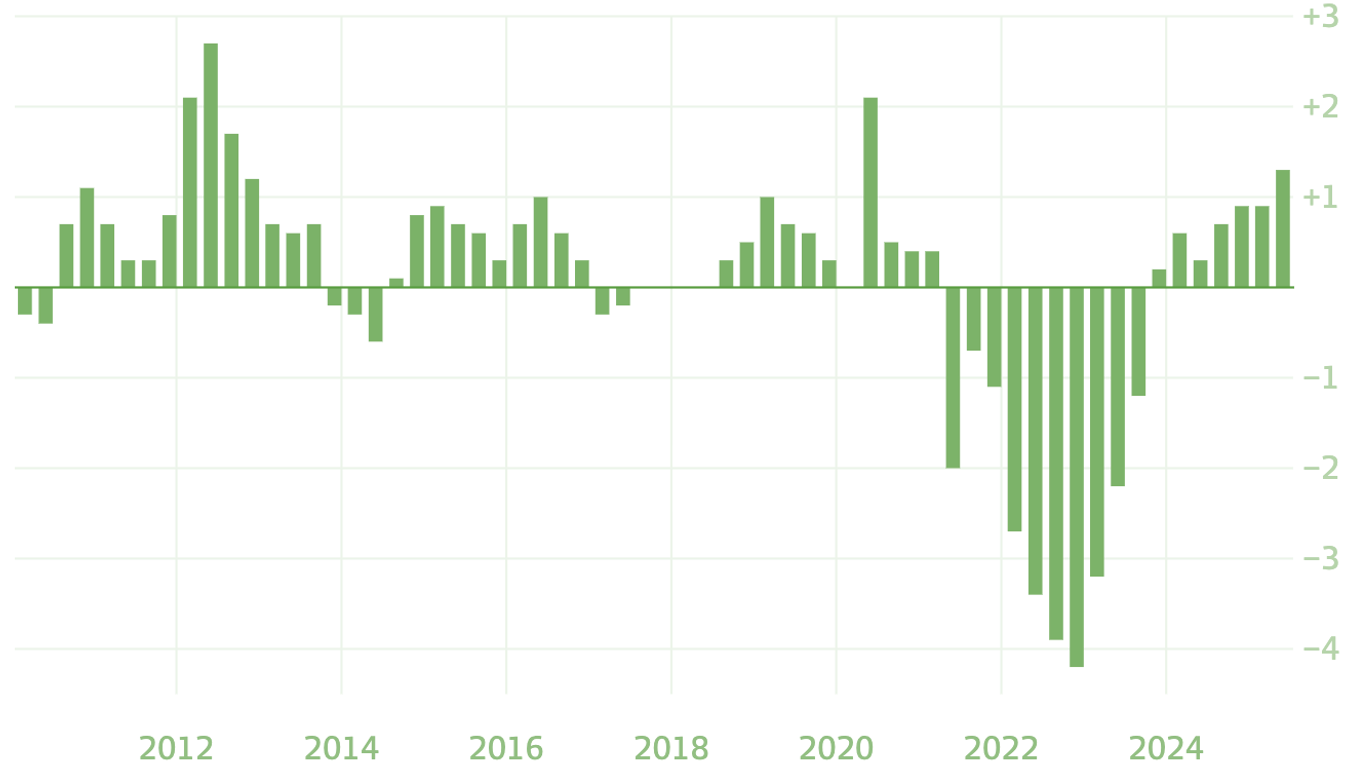
Economic Indicators
Economic fundamentals continue supporting buyer capacity. Real wages growth stands at 1.3% as of June, the highest level in years and about 2½ times the pre-COVID decade average of just 0.5%. This represents genuine purchasing power improvement rather than inflation-driven nominal increases.
Real wages growth, rolling annual (%)
The 75 basis point cut to the cash rate since February has played a key role in supporting housing activity. Borrowing capacity, based on the median household income of $106,000, has increased by around 7.0% since the first rate cut. This improvement in serviceability, combined with lower debt servicing costs and real wage growth, provides a solid foundation for continued buyer participation.
Household financial resilience has improved markedly. The share of mortgage holders in arrears, behind on repayments by more than 90 days, has declined to approximately 0.7%, matching pre-pandemic levels. The bottom quarter of income earners with mortgages have accumulated enough savings to afford 10 months of repayments, while the top quarter maintains 20 months of buffer.
Time it takes to save a deposit with and without the new scheme
The jobs market remains tight, with the unemployment rate holding at 4.2% in August. The under-employment rate, at 5.7%, hasn't been this low since 1991. Although labour markets are expected to loosen somewhat, conditions are expected to remain tight, further supporting housing demand and price growth.
This financial stability supports continued market participation and reduces downside risk, even as the RBA maintains restrictive monetary policy settings.
RBA Rate Hold & Inflation Uncertainty
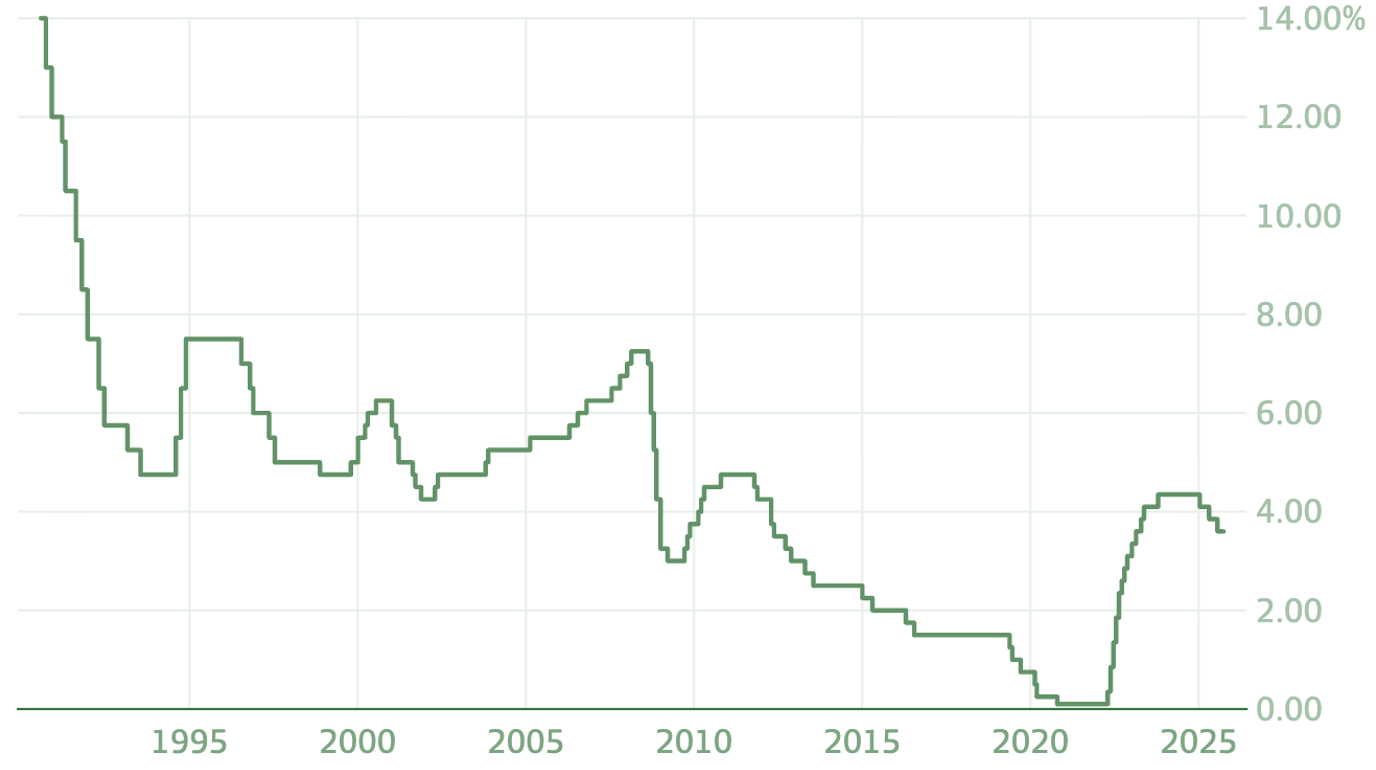
The Reserve Bank's decision to hold the official cash rate at 3.6% at Tuesday's meeting came as inflation data revealed an unwelcome return to 3%, creating uncertainty around the timing of further rate cuts.
Headline inflation increased to 3% in August from 2.8% in July, driven primarily by the expiry of state and federal government electricity rebates. However, the uptick raises questions about the disinflationary trajectory that had encouraged expectations for continued rate reductions.
Annual inflation (%)
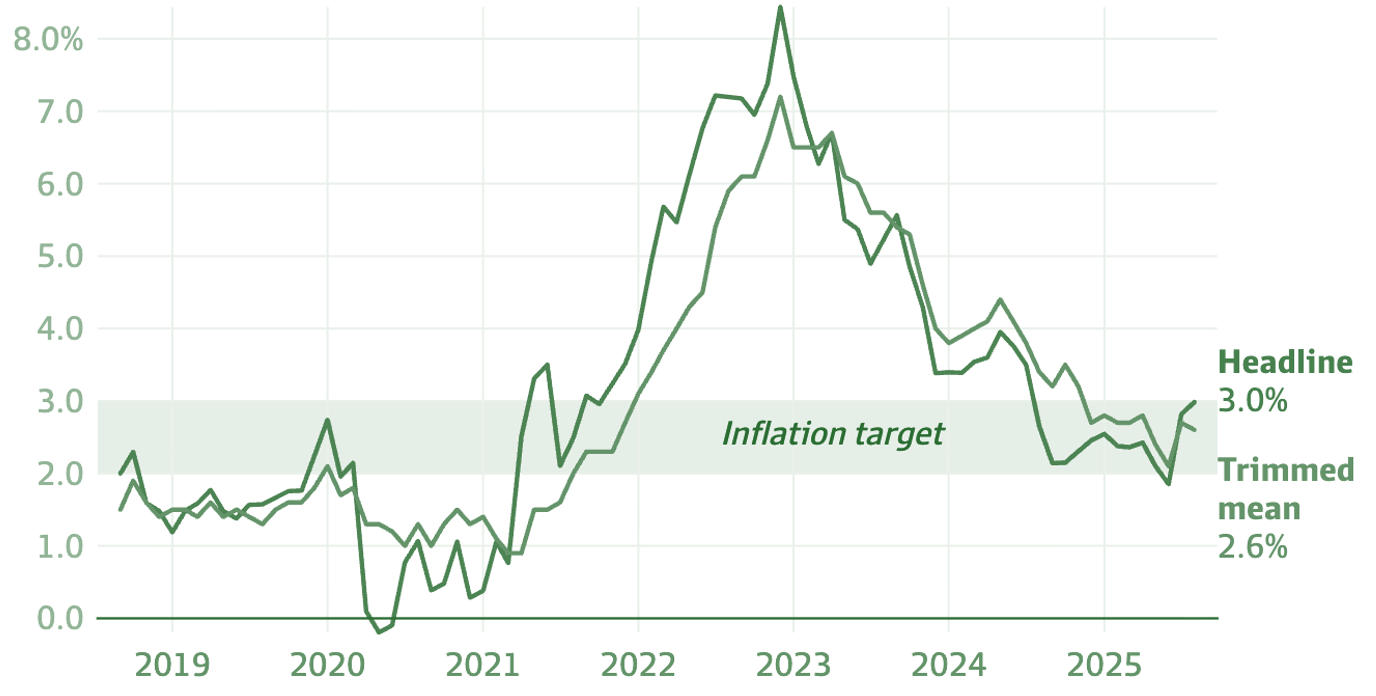
Governor Michele Bullock issued a clear warning about the inflation outlook: "We do have to aim for 2.5 per cent. So if we think that we're not continuing to go down towards 2.5, then I think we will have to be thinking about what's the appropriate stance of policy."
Services inflation has proven particularly sticky, with increases evident in restaurant meals, takeaway food, and streaming services. Bullock acknowledged this challenge: "My focus was on determining the interest rate path that would deliver inflation sustainably within the RBA's 2 per cent to 3 per cent target band."
RBA cash rate (%)
Market expectations for a November rate cut have cooled substantially. Traders now ascribe just a 40% probability to a cut at the board's November 3-4 meeting, down from 50% before the RBA announcement and 70% before the August inflation release.
Deutsche Bank chief economist Phil O'Donaghoe shifted his forecast, no longer expecting rate cuts in 2025: "In terms of what has driven our call change, the details of Australia's August CPI look materially more uncomfortable for the RBA than we expected. We now expect the RBA's next policy move to be a 25 basis point cut in February, and another 25 basis point cut in May."
However, Westpac chief economist Luci Ellis maintains a more dovish view: "The RBA board was notably cautious and noncommittal about the outlook for interest rates. Maximum optionality has been retained but in our view, the choice is still when to cut further, not whether."
The inflation uncertainty creates a more complex outlook for property markets than existed in September, when further rate cuts appeared virtually certain.
Strategic Implications for Investors
The convergence of record price momentum, scheme-driven demand, and critical supply shortages creates a challenging but opportunity-rich environment for property investors who understand the shifting dynamics.
The First Home Buyer Guarantee's launch means the anticipated demand wave has arrived. Investors who positioned ahead of October 1st may benefit from timing, while those entering now face increased competition in entry-level segments but potential opportunities in understanding where price pressure will concentrate.
The unit market presents particular strategic interest. With 93% of suburbs having median unit values below scheme price caps compared to only 50% for houses, apartments in well-located areas offer both yield advantage in a 1.4% vacancy environment and exposure to the demand surge from scheme participants.
Godfrey Dinh, CEO of Futurerent, sees the opportunity: "With 93% of suburbs having unit values below the scheme caps compared to only 50% for houses, we're seeing many investors pivot toward apartments in well-located areas. The unit market offers both yield advantage in a 1.4% vacancy environment and capital growth potential as first home buyer demand concentrates below those price thresholds."
Geographic focus matters more than ever. Suburbs sitting just below price caps face immediate demand pressure, while extreme supply shortages in Darwin, Perth, and Brisbane create fundamental support for continued growth in these markets.
Melbourne's relative undervaluation compared to Sydney, with the price gap the widest since 1999, suggests potential for catch-up growth as investors recognise the value proposition in Australia's second-largest city.
However, the RBA's rate hold and inflation concerns introduce uncertainty. With November rate cut probability down to 40%, investors must balance opportunity against potential headwinds if monetary policy remains restrictive longer than anticipated.
Dinh adds: "The spring trifecta of rate cuts, expanded government scheme, and seasonal momentum creates conditions we haven't seen in over the past couple of years. Access to capital access becomes even more valuable in this environment."
Market Outlook
The final quarter of 2025 appears set for continued price growth, driven by converging supportive factors, though sticky inflation may delay the next round of interest rate cuts until early 2026.
The combination of rate cuts already delivered, the FHBG scheme bringing 70,000 additional eligible buyers, and traditional spring selling season momentum creates unusually strong demand conditions.
Supply constraints operate on two levels - immediate listing inventory sits 20% below average at 121,000 properties versus the typical 150,000, while construction approvals lag 51,000 units behind the annual target of 240,000. RBA Governor Bullock's confirmation that housing supply solutions won't impact the market for more than two years means the current shortage will persist well into 2026-2027.
SQM Research managing director Louis Christopher maintains his acceleration view: "I think it's only a matter of time before we see an acceleration in housing price growth. Indeed, we're expecting it for the remainder of this year, and that's on the back of the multiple interest rate cuts, plus the bringing forward of the 5 per cent home deposit incentive."
Powell from Domain emphasises the scheme's impact: "What it is likely to do is bring a wave of first-time buyers to market, that, in itself, is going to help to prop up prices below those property caps across each capital city. So I'm expecting the more affordable end of house prices and unit prices to be held up by this wave of first-time buyers that are coming in."
The investor return adds more tail-winds for prices, as this cohort's 6.6% credit growth rate suggests growing appetite for property exposure, particularly in Queensland where yield and growth prospects align.
"Looking ahead, the fundamentals remain compelling despite potential delays to the next rate cut," says Godfrey Dinh, CEO of Futurerent. "Investor credit growth at 6.6% is now outpacing owner-occupiers, vacancy sits at historic lows of 1.4%, construction supply won't improve for at least two years according to the RBA Governor, and the First Home Buyer Guarantee is bringing 70,000 participants into a market already 20% short on inventory. The question for entry-level segments isn't whether prices will rise—it's how quickly and which specific locations will see the steepest acceleration. Rate cut timing creates short-term noise, but the structural drivers point to sustained momentum through 2026."
How Futurerent Can Help
September’s market dynamics highlight the importance of timing and capital access for property investors seeking to capitalise on current conditions before entry-level price acceleration intensifies.
Property investors know that prices grow faster than you can save. And even with a foot on the property ladder, taking the next step shouldn't mean asking the bank's permission or signing up to another lifetime of interest when all you need is to unlock what's already yours.
What if you could access that equity without refinancing, selling the property, or waiting until it's too late?
That's why investors turn to Futurerent to unlock their equity without the usual trade-offs. There's no refinancing, no painful paperwork, and no impact on your credit score.
Futurerent helps investors cash out up to $100,000 per property, with funds in your account in just 2 business days. The property returns the cash out from a fixed portion of the rent over 3 years.