This month delivered an RBA pause, an inflation print that looks better than it is, a housing market splitting in two, and a fresh set of ATO statistics that quietly dismantle several of the loudest claims about property investment. Taken together, the picture is very different from the headlines. Here is what the data actually shows, and what it means for investors.
Key highlights
- RBA held the cash rate at 4.35% on 16 June, its first pause this year after three consecutive hikes
- Headline inflation fell to 4.0%, a second consecutive monthly fall, but trimmed mean rose to 3.6%, its highest since September 2024
- Cotality's national Home Value Index was flat in May; Sydney fell 0.9% and Melbourne 0.8%
- National rental vacancy held at 1.2% in May, with every capital city below 2%
- ATO data: the property investor base grew by more than 74,000 in a single year, to 2.34 million
- Almost half of all investors (45.8%) are positively geared
- At four or more properties, the majority of investors are positively geared
- All four major banks have pulled back from trust and company lending over the past year
The RBA paused, but this is not the turn
On 16 June, the Reserve Bank held the cash rate at 4.35%, its first pause this year after three consecutive hikes. Much of the coverage framed it as relief, the top of the cycle, the moment the tide turned. The data underneath tells a more careful story, and it matters for anyone holding or buying property.
The decision to hold was unanimous, but Governor Michele Bullock was explicit that it should not be read as the end of the inflation fight. Further tightening remains on the table if price pressures do not ease.
The headline number is flattering, and temporarily so
May CPI fell to 4.0% from 4.2%, its second consecutive monthly fall. At first glance that looks like progress. It is not quite what it seems. The RBA's preferred underlying measure, trimmed mean inflation, actually rose to 3.6%, its highest reading since September 2024. The headline fall was largely a fuel story: when the Government cut the fuel excise from 52.6 to 20.6 cents per litre on 1 April, petrol prices stopped climbing as fast, and that dragged the headline number down. The gap between the two measures has narrowed from 0.8 percentage points in April to 0.4 in May, as the flattering headline sinks toward the stickier underlying rate that is still climbing.
The fuel excise relief is being assessed week to week, and the Treasurer has said it will not go on forever. When it ends, that downward pressure on the headline reverses. Strip fuel out, and underlying inflation is still moving the wrong way. The investors reading this pause as the start of rate cuts may be planning around a turn the underlying data does not yet support.
3.6% Trimmed mean inflation, May 2026, the highest since September 2024.

Source: ABS Consumer Price Index, Australia, May 2026.
The housing market has turned, and the divergence is the opportunity
The RBA's own statement acknowledged that momentum in the housing market has shifted, with prices now falling in some capital cities. The data backs it up. Cotality's national Home Value Index was flat in May. Sydney fell 0.9% and Melbourne fell 0.8%, and both are now sitting below the cyclical highs they reached last November.
But a flat national figure hides a two-speed market. While Sydney and Melbourne soften, the mid-sized capitals have held up far better, supported by low stock and genuine demand. This is the divergence that does not show up in a national headline, and it is where investors with capital ready tend to find the better opportunities. Softer conditions in the largest markets mean less competition and more room to negotiate, while the tighter markets keep running.
Softer conditions in the biggest markets mean less competition for capital-ready investors, while the tighter markets keep running. That gap is where the better buys tend to be found.
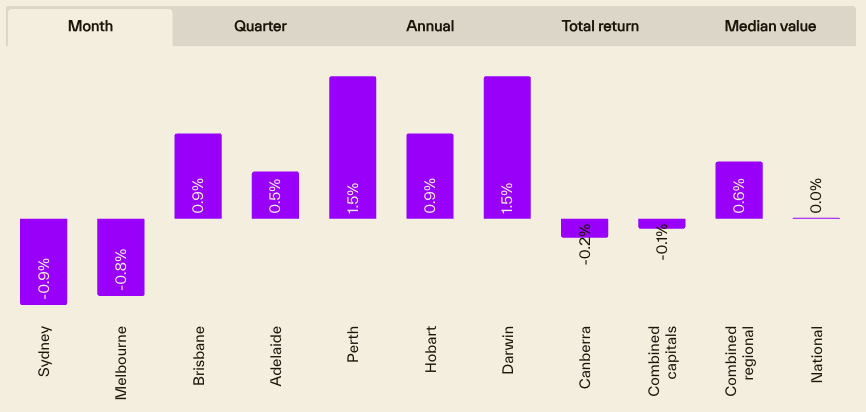
Source: Cotality Home Value Index, May 2026
The rental story has not changed, and that is the point
National rental vacancy held at 1.2% in May, with every capital city still below 2%. Brisbane remains one of the tightest markets in the country. The Budget changes to negative gearing and capital gains tax, which begin in July 2027, are expected to reduce new investment activity over time, which structurally tightens an already tight rental market further out.
The May CPI reinforces the supply squeeze. Within the housing group, which rose 6.5% annually, new dwelling costs accelerated to 5.6% (up from 4.7% in April) as builders pass through higher labour and materials costs, and rents ticked back up to 3.6%. Rising construction costs make new supply harder to bring to market, which keeps pressure on both prices and rents for the stock that already exists.
A softening sales market and a tight rental market at the same time is an unusual combination. It favours investors who already hold and can access their equity without selling into a cooling market. When values soften but rental demand stays tight, selling is the least attractive way to access capital.
The ATO data quietly dismantles the doom narrative
This is where the month's most useful information sits. The ATO has just released its 2023-24 taxation statistics, and the numbers cut against almost everything the headlines have been saying about property investment.
The investor base grew, it did not shrink
Despite rising rates, Budget noise, and a constant drumbeat about investors leaving the market, the number of Australians with an interest in a rental property grew by more than 74,000 in a single year, from 2.26 million to 2.34 million. People did not flee property investment. More of them entered it.
+74,460 Growth in the number of property investors in a single year, to 2.34 million.
Source: ATO Taxation Statistics 2023-24, Table 8.
Almost half of investors are positively geared
The negative gearing debate is loud, but it affects fewer investors than most people assume. In 2023-24, almost half of all property investors, 45.8%, were net rent neutral or in profit. Negative gearing only matters to investors running at a loss, and the public conversation overstates how many that is.
This also reframes the Budget. The changes to negative gearing and CGT apply to established properties purchased after Budget night and start in July 2027. Every existing investor is grandfathered. Combine that with the fact that almost half of investors are positively geared anyway, and the population actually affected by the negative gearing change is far smaller than the headlines suggest.
The real insight: cashflow turns positive with scale and time
Here is the part of the data worth sitting with. Single-property investors are mostly negatively geared, with only around 45% in profit. But the picture flips as portfolios grow. At four properties, the majority, around 51%, are positively geared. At five properties it rises to about 52%, and at six or more, to around 55%.
The mechanism is simple. Rents rise over time while the debt stays fixed. The investors who hold through the cycle and build scale are the ones whose portfolios eventually pay them, rather than the other way around. Time in the market does the work.

But the squeeze on the way there is real
The same data shows the average investor's net rent position swung from a small profit of $696 in 2022-23 to a loss of $1,148 in 2023-24. Rising rates have genuinely tightened cashflow on the journey to scale. The gap between where an investor is now and the positive-cashflow portfolio they are building toward is, more than anything, a capital problem: deposits for the next property, and the capex, repairs and maintenance that protect rent on the properties they already hold.
$696 to -$1,148 The swing in the average investor's net rent position, 2022-23 to 2023-24.
Source: ATO Taxation Statistics 2023-24, Table 5.
The banks are retreating from exactly the investors growing fastest
Here is what makes this moment different. Trust and company structures have become one of the fastest-growing parts of the property investment market. Yet over the past year, all four major banks have pulled back from lending to them. Macquarie stopped first. Commonwealth Bank tightened. Westpac and NAB have been reviewing and restricting their appetite for the structures.
Cash-out and equity release in particular have become very hard to obtain for properties held in company and trust structures. Lenders are now also factoring the proposed negative gearing changes into how they assess serviceability, which tightens borrowing capacity further. For an investor with a trust structure who needs capital to renovate, maintain, or fund the next deposit, the traditional path through the banks is narrowing at the precise moment the ATO data shows the investor base growing. That is a real and widening gap.
What this means in practice
1) Do not assume relief is coming.
The gap between the falling headline and the rising trimmed mean is the signal worth watching. Rates staying where they are for longer is the base case, not cuts. Plan around the data, not the headline.
2) The opportunity is in the markets that have softened, not the ones still hot.
Sydney and Melbourne below their cyclical highs is the kind of window that tends to look obvious only in hindsight. Capital-ready investors are watching the markets that have cooled.
3) Building scale is how cashflow turns positive, and that takes capital.
The ATO data is clear that portfolios pay you once you reach scale. Getting there requires funding the next deposit and protecting the rent on what you already hold.
4) When values soften but rents stay tight, selling is the worst way to access capital.
This is the environment where investors unlock equity and keep the asset, rather than crystallising a sale into a cooling market.
How Futurerent can help
When the sales market softens, the rental market stays tight, and the banks pull back from trust and company lending, the strongest position is being able to access your equity without selling and without the bank.
Futurerent helps property investors cash out up to $100,000 per investment property in 2 business days, without refinancing, without a credit impact, and without the trust and company lending restrictions tightening across the majors. The advance is repaid from a fixed portion of your rental income over three years. The property returns the cash out, not your wallet, and you keep the asset through the cycle.
It is built for exactly the things that move investors toward a positively geared portfolio: funding the next deposit, or the renovation and maintenance that protect and grow rent on what you already own. If you want to know what you could access on your investment property, use the calculator below or reply with the property address, weekly rent and rough mortgage balance, and we will come back with indicative figures on what is available, the total cost, and the cashflow impact.